EMA and Heikin Ashi Trading Strategy
Author: ChaoZhang, Date: 2023-10-17 16:11:19Tags:

Here is an article about the EMA and Heikin Ashi trading strategies:
Overview
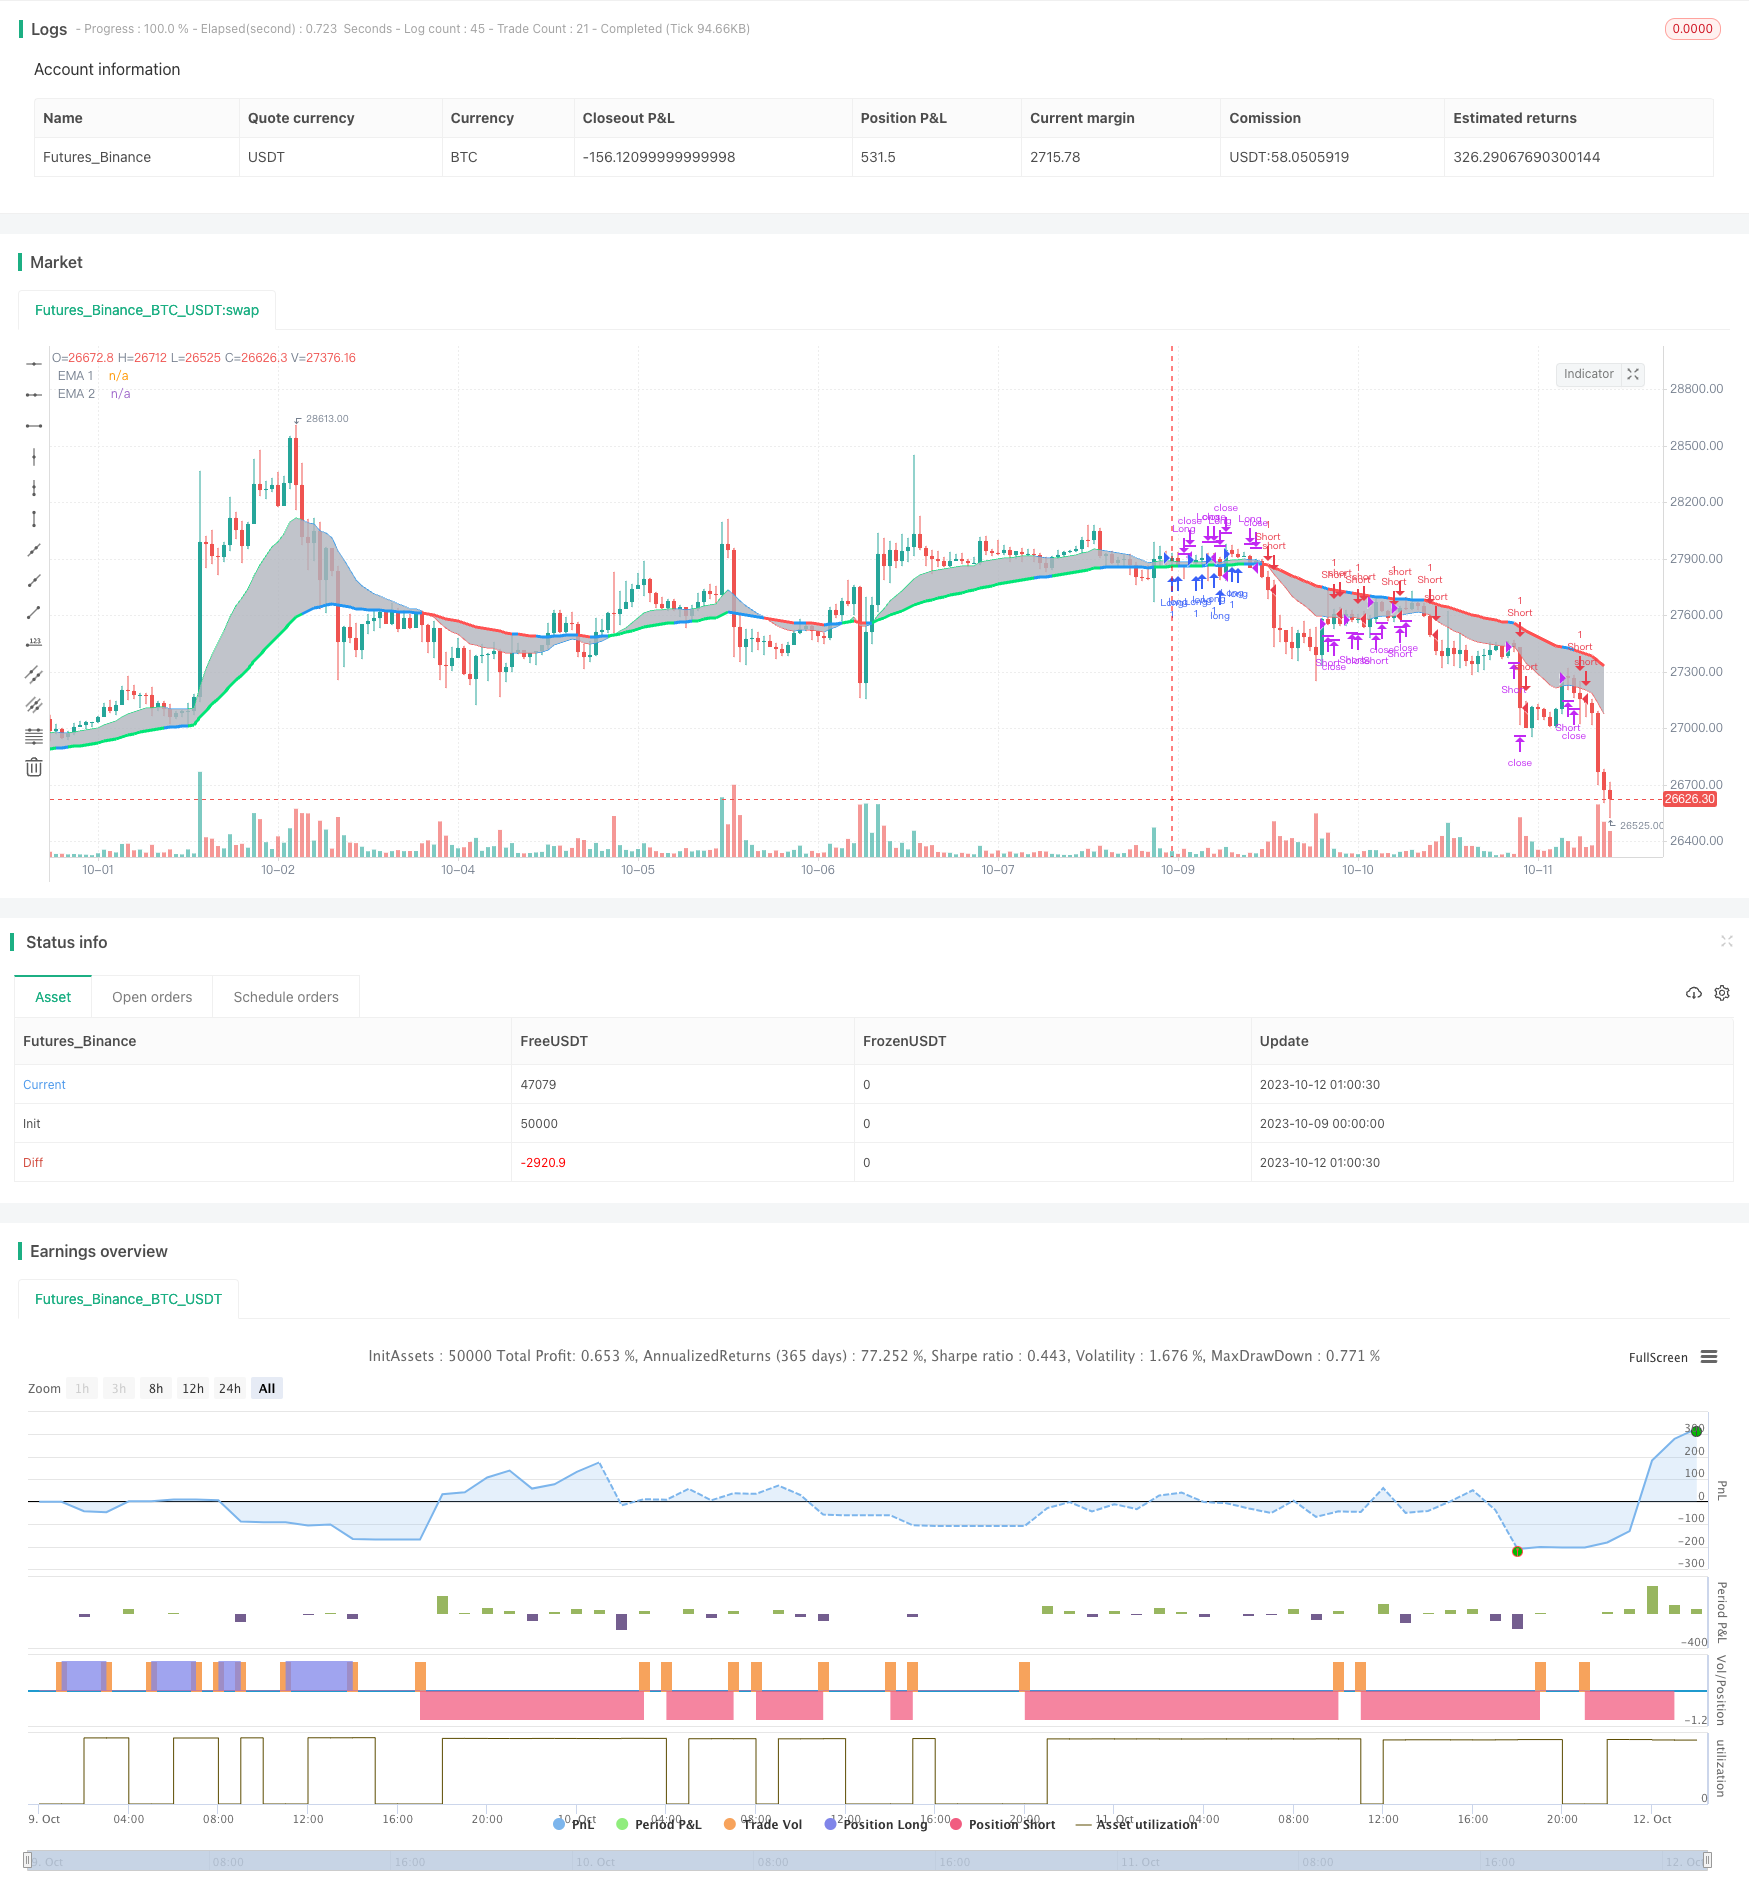
This strategy uses exponential moving averages (EMA) and Heikin Ashi to determine trends and generate trading signals when prices break through EMAs of different periods.
Trading Logic
The strategy uses 15-period and 50-period EMAs. It calculates the current Heikin Ashi closing price and compares it to the EMAs. If the closing price is above both EMAs and the 15-period EMA is above the 50-period EMA, a long signal is generated. If the closing price is below both EMAs and the 15-period EMA is below the 50-period EMA, a short signal is generated.
When the price breaks back above the 15-period EMA, a reverse trade is made.
Advantage Analysis
Using EMAs helps filter out market noise and determine trend direction.
Combining EMAs of different periods captures both short-term and mid-term trends.
Heikin Ashi filters out false breakouts and confirms trading signals.
The strategy is simple and easy to implement.
Risk Analysis
EMAs have lag and may miss trend turning points.
Fixed parameters fail to adapt to changing markets, requiring dynamic optimization.
Frequent trading leads to potentially high transaction costs.
Breakout trading is susceptible to false breakouts, requiring additional indicator confirmation.
Risks can be reduced through parameter optimization, integrating other indicators, etc.
Optimization Directions
Dynamically optimize EMA periods based on market changes.
Optimize breakout filters to avoid false breakouts, e.g. add volume confirmation.
Incorporate other indicators like MACD to confirm signals.
Use lagging EMA for trends and leading EMA for ranges.
Summary
This strategy uses EMAs to determine trend direction and Heikin Ashi to verify signals. It is simple and straightforward but EMA lag and false breakout risks need to be addressed. Improvements can be made via parameter optimization, indicator integration to reduce risk and improve strategy performance.
/*backtest
start: 2023-10-09 00:00:00
end: 2023-10-12 02:00:00
period: 1h
basePeriod: 15m
exchanges: [{"eid":"Futures_Binance","currency":"BTC_USDT"}]
*/

//@version=3
strategy("EMA & Heikin Ashi", shorttitle="EMA & Heikin Ashi", overlay=true, initial_capital=1)


// squaa's Strategy
//
// Idea by Thw on March 10, 2018.
//
//
// The strategy should be used with high leverages,
// never stop running,
// and is always long or short.

// Input
price = input(close)
MA1_Length = input(15)
MA2_Length = input(50)


haclose = request.security(heikinashi(syminfo.tickerid), timeframe.period, close)

// === FUNCTION EXAMPLE ===
start     = timestamp(2018, 01, 01, 20, 00)  // backtest start window
window()  => time >= start ? true : false // create function "within window of time"


// Calculation
MA1 = ema(price, MA1_Length)
MA2 = ema(price, MA2_Length)

// Strategy
long = haclose > MA1 and haclose > MA2 and MA1 > MA2 and window()
short = haclose < MA1 and haclose < MA2 and MA1 < MA2 and window()

// MA trend output color
MA2_color = long?lime:short?red:blue

strategy.entry("Long", strategy.long, when=long)
strategy.entry("Short", strategy.short, when=short)
strategy.close("Long", when=haclose < MA1)
strategy.close("Short", when=haclose > MA1)


// MA output
EMA1 = plot(MA1, title="EMA 1", style=linebr, linewidth=1, color=MA2_color)
EMA2 = plot(MA2, title="EMA 2", style=linebr, linewidth=3, color=MA2_color)
fill(EMA1, EMA2, color=silver, transp=50)

//plot(strategy.equity, title="equity", color=red, linewidth=2, style=areabr)
- RSI Rising Crypto Trending Strategy
- EMA Slope Cross Trend Following Strategy
- TAM Intraday RSI Trading Strategy
- Exponential Moving Average Crossover Strategy
- Moving Average Crossover Strategy
- Tracking Breakout Strategy
- Dual Moving Average Monitoring Model
- Mean Reversion Strategy Based on ATR
- Relative Volume Trend Following Trading Strategy
- MACD Trend Balancing Strategy
- Trend Following Long Only Strategy
- Multi-model Candlestick Pattern Combination Strategy
- Channel Reversion Trading Strategy Analysis
- Dual Indicator Slight Reversal Trading Strategy
- Surf Rider Strategy
- Momentum Tracking Strategy Based on Indicator Integration
- The Hulk Pullback Reversal Strategy
- Multifactor Dynamic Money Management Strategy
- Triple EMA With Trailing Stop Loss Strategy
- Adaptive Volatility Finite Volume Elements Strategy