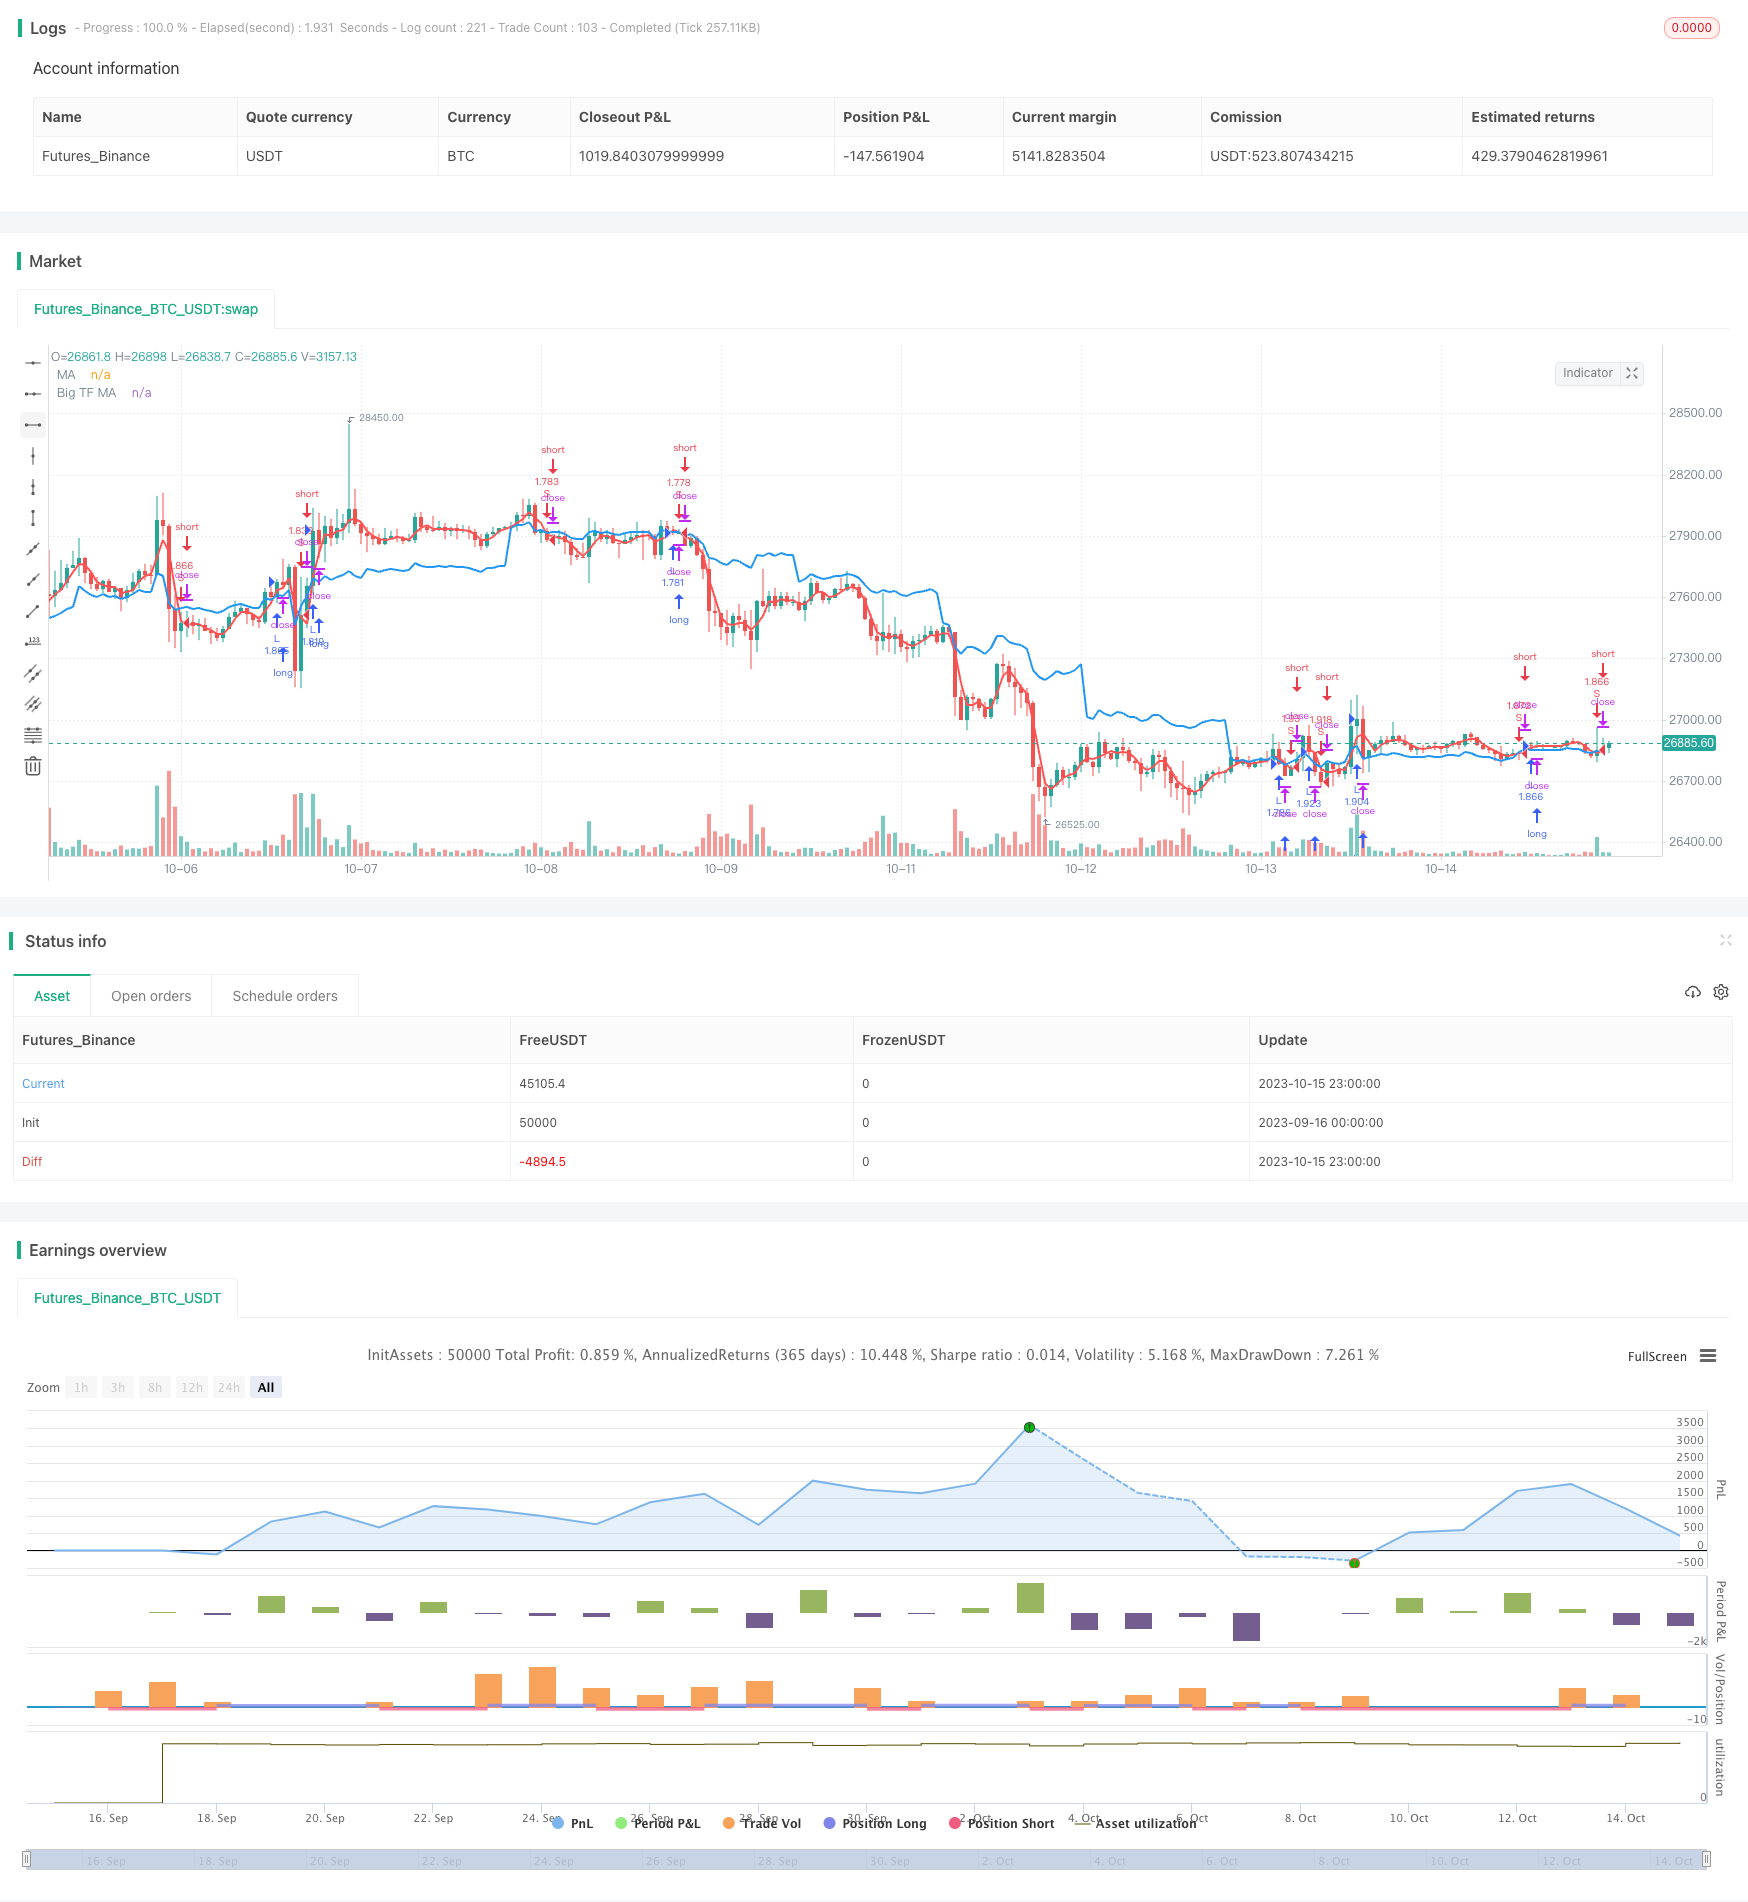
Overview
This is an automatic trading strategy that goes long or short based on the crossover of two exponential moving averages (EMAs) with different time periods. It uses simple technical indicators and is very suitable for beginners to learn and practice.
Principle
The strategy uses two EMAs, one is the EMA on a bigger time frame, and the other is the EMA on the current time frame. When the current EMA crosses above the bigger EMA, it goes long. When the current EMA crosses below the bigger EMA, it goes short.
Specifically, the strategy first defines two EMA parameters:
- tf - The bigger time frame, default daily.
- len - The EMA period length, default 3.
Then it calculates two EMAs:
- ma1 - 3-day EMA on the daily time frame.
- ma2 - 3-day EMA on the current time frame.
Finally, it enters trades based on:
- When ma2 > ma1, it goes long.
- When ma2 < ma1, it goes short.
By judging the trend direction through crossovers between two EMAs of different periods, it automates trading.
Advantages
The strategy has the following advantages:
- Simple principle, easy to understand and implement, very suitable for beginners.
- Trend following, obeying the trend, can make decent profits.
- Using EMAs, more sensitive to price changes, can timely capture trend reversals.
- Combination of EMAs of different periods can utilize their respective strengths and improve system stability.
- No need for too many parameters, easy to test and optimize, convenient for live trading.
Risks
The strategy also has some risks:
- Weak trend following ability, may be whipsawed in ranging markets.
- Lagging in double EMA crossovers, may miss some opportunities.
- Cannot effectively filter disorderly crossovers between two EMAs.
- Relies merely on simple EMAs, hard to adapt to complex markets.
Risks can be reduced by setting stop loss, optimizing parameters, adding other indicators etc.
Optimization
The strategy can be optimized in the following aspects:
- Test different big period EMA parameters to find the optimal combination.
- Add volume filter to avoid false signals.
- Incorporate trend indicators to increase position sizing and efficiency.
- Set adaptive stop loss to control single trade loss.
- Optimize position sizing according to market conditions.
- Add machine learning models to make the strategy more intelligent.
Conclusion
The EMA crossover strategy captures trends with simple indicators, suitable for beginners to learn and practice. Has large room for optimization by introducing more technical indicators and models to develop more effective quantitative trading strategies.
/*backtest
start: 2023-09-16 00:00:00
end: 2023-10-16 00:00:00
period: 1h
basePeriod: 15m
exchanges: [{"eid":"Futures_Binance","currency":"BTC_USDT"}]
*/

//@version=3
strategy("Noro's Singapore Strategy", shorttitle = "Singapore str", overlay = true, default_qty_type = strategy.percent_of_equity, default_qty_value = 100, pyramiding = 0)

//Settings
needlong = input(true, defval = true, title = "Long")
needshort = input(true, defval = true, title = "Short")
capital = input(100, defval = 100, minval = 1, maxval = 10000, title = "Lot")
tf = input("D", title = "Big Timeframe")
len = input(3, minval = 1, title = "MA length")
src = input(close, title = "MA Source")
fromyear = input(1900, defval = 1900, minval = 1900, maxval = 2100, title = "From Year")
toyear = input(2100, defval = 2100, minval = 1900, maxval = 2100, title = "To Year")
frommonth = input(01, defval = 01, minval = 01, maxval = 12, title = "From Month")
tomonth = input(12, defval = 12, minval = 01, maxval = 12, title = "To Month")
fromday = input(01, defval = 01, minval = 01, maxval = 31, title = "From day")
today = input(31, defval = 31, minval = 01, maxval = 31, title = "To day")

//MAs
ma1 = request.security(syminfo.tickerid, tf, sma(src, len))
ma2 = sma(src, len)
plot(ma1, linewidth = 2, color = blue, title = "Big TF MA")
plot(ma2, linewidth = 2, color = red, title = "MA")

//Trading
size = strategy.position_size
lot = 0.0
lot := size != size[1] ? strategy.equity / close * capital / 100 : lot[1]

if ma2 > ma1
    strategy.entry("L", strategy.long, needlong ? lot : 0, when = (time > timestamp(fromyear, frommonth, fromday, 00, 00) and time < timestamp(toyear, tomonth, today, 23, 59)))
if ma2 < ma1
    strategy.entry("S", strategy.short, needshort ? lot : 0, when = (time > timestamp(fromyear, frommonth, fromday, 00, 00) and time < timestamp(toyear, tomonth, today, 23, 59)))
if time > timestamp(toyear, tomonth, today, 23, 59)
    strategy.close_all()