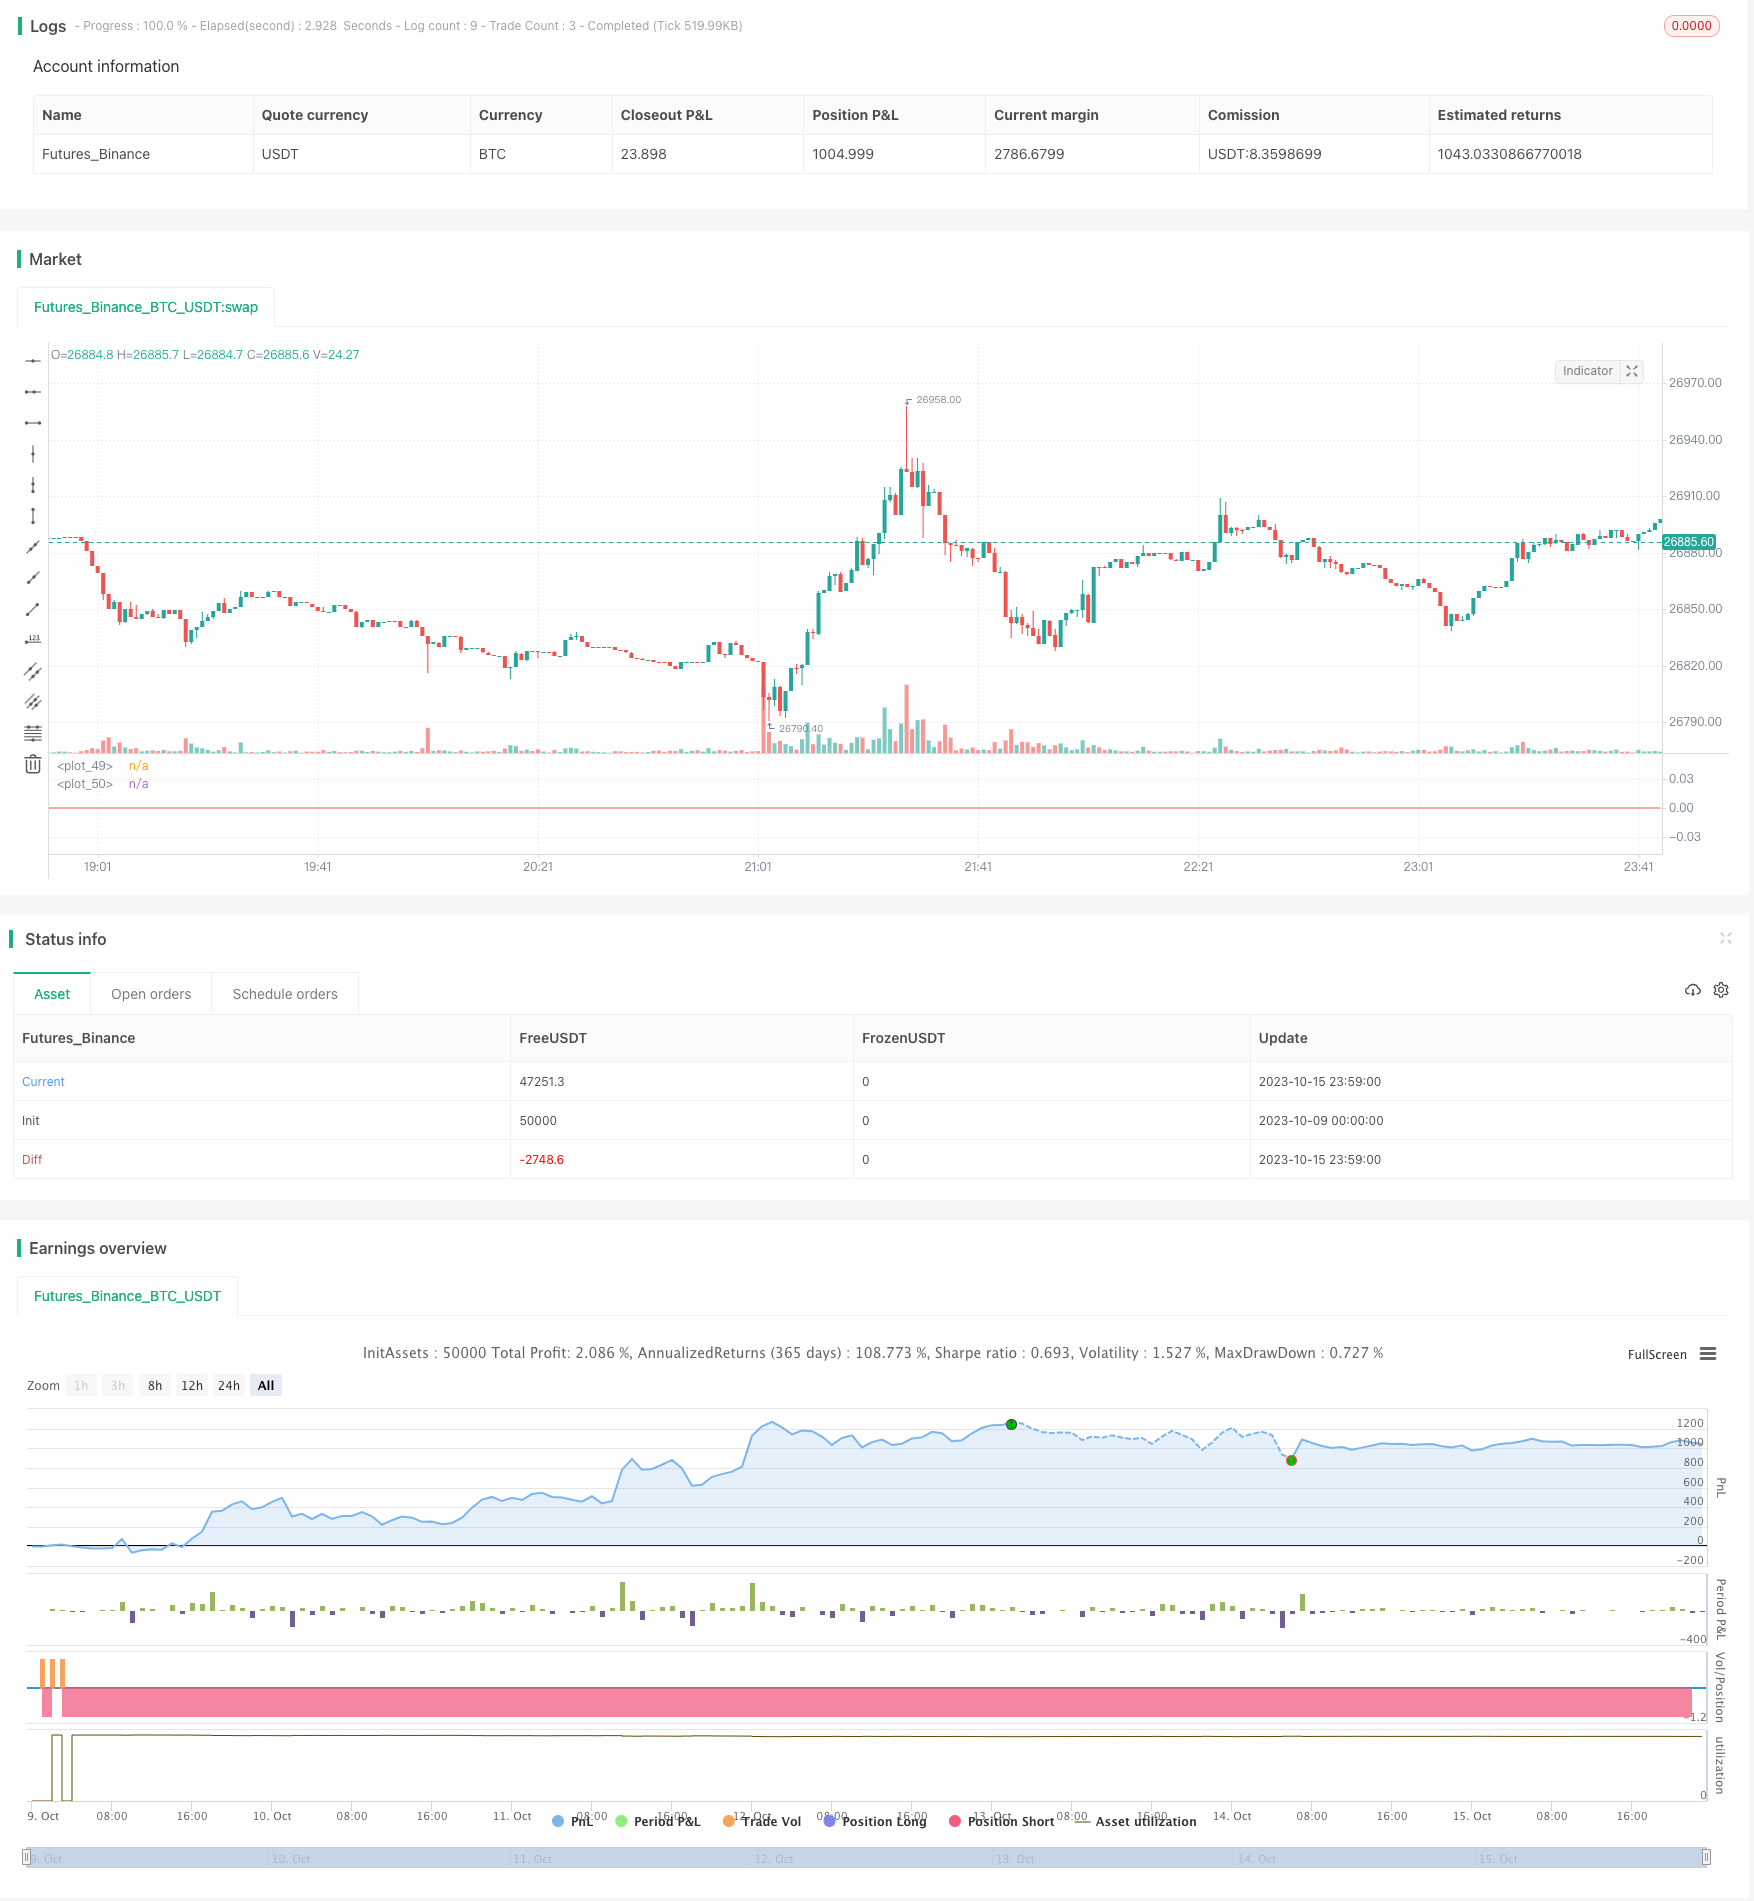
EMA Slope Cross Trend Following Strategy
Author: ChaoZhang, Date: 2023-10-17 17:02:30Tags:

Overview
This strategy uses the cross of the slopes of two EMAs with different lengths to generate trend following signals. By default, 130 and 400 are used, which perform very well.
The conditions that make the strategy enter the market are: - Fast Slope > Slow Slope and price > EMA 200: go Long - Fast Slope < Slow Slope and price < EMA 200: go Short
When the simple slopes cross in the opposite direction, it closes the position.
The strategy performs best on Bitcoin and the most liquid and capitalized altcoins, but works greatly on volatile assets as well, in particular if they often go trending. Works best on the 4h timeframe.
There is also an optional Volatility filter, which opens the position only if the difference between the two slopes is more than a specific value. The purpose is to avoid opening positions when the price is going sideways and the noise is much greater than the signal.
Enjoy it!
Strategy Logic
The core of this strategy is to compare the slopes of two EMAs with different lengths.
First, EMAs with lengths of 130 and 400 are calculated, then the slopes of each are calculated, then EMAs of length 3 are calculated on each slope to get smoothed slope curves.
When the fast EMA slope crosses above the slow EMA slope, a buy signal is generated. When the fast EMA slope crosses below the slow EMA slope, a sell signal is generated.
To filter out noise, a 200 period EMA can be used as a trend filter, considering long signals only when the price is above the EMA, and short signals only when below.
In addition, a volatility filter can be used, generating signals only when the difference between the two slopes is greater than a threshold, to avoid cases where the slopes cross but volatility is insufficient.
When the fast and slow slopes cross inversely, positions are closed to stop profits/losses.
Advantage Analysis
Using slope crosses to generate signals can effectively track trends
Adjusting EMA period combinations can adapt to different market conditions
The trend filter avoids being misled by choppy price action
The volatility filter filters out false signals
Simple and clear logic, easy to understand and implement
Can be used on multiple timeframes
Risk Analysis
Frequent opens and closes may occur in large ranging markets
Inappropriate EMA periods could miss trend turning points
Parameters should be tuned to adapt to changing market conditions
Like MA systems, large trends may reverse at extremes
Optimization Directions
Try different EMA period combinations to find optimal parameters
Choose parameters according to asset characteristics and market conditions
Consider adding stop loss strategies to control risk
Consider dynamically adjusting EMA periods
Test different volatility threshold values
Test effectiveness across timeframes
Summary
The strategy has clear, easy to understand logic, using EMA slope crosses to generate signals and effectively track trends. The trend and volatility filters reduce noisy trades. Tuning EMA period combinations adapts it to varying market conditions. Overall a simple and practical trend following strategy that is worth testing and optimizing in live trading.
/*backtest
start: 2023-10-09 00:00:00
end: 2023-10-16 00:00:00
period: 1m
basePeriod: 1m
exchanges: [{"eid":"Futures_Binance","currency":"BTC_USDT"}]
*/

//@version=4
// strategy(title="Slopes",initial_capital=1000, default_qty_type=strategy.percent_of_equity, commission_type=strategy.commission.percent, commission_value=0.06, slippage = 2, default_qty_value=30, overlay=false)

//definizione input

start = timestamp(input(2018, "start year"), input(1, "start month"), input(1, "start day"), 00, 00)
end = timestamp(input(2020, "end year"), input(1, "end month"), input(1, "end day"), 00, 00)

average = input (title="Source MA Type", type=input.string, defval="EMA",options=["EMA","SMA"])

len1=input(130,title="Fast MA Length")
len2=input(400,title="Slow MA Length")

smoothingavg = input (title="Smoothing MAs Type", type=input.string, defval="EMA",options=["EMA","SMA"])
smoothingavglen = input (3,title="Smoothing MAs Length")

trendfilter=input(true,title="Trend Filter")
trendfilterperiod=input(200,title="Trend Filter MA Period")
trendfiltertype=input (title="Trend Filter MA Type", type=input.string, defval="EMA",options=["EMA","SMA"])

volatilityfilter=input(false,title="Volatility Filter")
volatilitydelta=input(0.0003,step=0.0001,title="Delta Slopes EMA")

//variabili

m1 = if average == "EMA"
    ema(close,len1)
else
    sma(close,len1)

m2=if average == "EMA"
    ema(close,len2)
else
    sma(close,len2)

slp1=(m1-m1[1])/m1
slp2=(m2-m2[1])/m2

e1=if smoothingavg == "EMA"
    ema(slp1,smoothingavglen)
else
    sma(slp1,smoothingavglen)

e2=if smoothingavg == "EMA"
    ema(slp2,smoothingavglen)
else
    sma(slp2,smoothingavglen)

plot(e1,color=color.yellow)
plot(e2,color=color.red)
//plot (abs(e1-e2),color=color.white)
//plot (ema(e1-e2,9),color=color.yellow)

//variabili accessorie e condizioni

TrendConditionL=if trendfiltertype =="EMA"
    close>ema(close,trendfilterperiod)
else
    close>sma(close,trendfilterperiod)

TrendConditionS=if trendfiltertype =="EMA"
    close<ema(close,trendfilterperiod)
else
    close<sma(close,trendfilterperiod)

VolatilityCondition = abs(e1-e2) > volatilitydelta

ConditionEntryL= if trendfilter == true
    if volatilityfilter == true
        e1>e2 and TrendConditionL and VolatilityCondition
    else
        e1>e2 and TrendConditionL
else
    if volatilityfilter == true
        e1>e2 and VolatilityCondition
    else
        e1>e2

ConditionEntryS= if trendfilter == true
    if volatilityfilter == true
        e1<e2 and TrendConditionS and VolatilityCondition
    else
        e1<e2 and TrendConditionS
else
    if volatilityfilter == true
        e1<e2 and VolatilityCondition
    else
        e1<e2

ConditionExitL=crossunder(e1,e2)
ConditionExitS=crossover(e1,e2)

if true
    if ConditionExitS
        if strategy.position_size < 0
            strategy.close("SLPShort")

if true
    if ConditionExitL
        if strategy.position_size > 0
            strategy.close("SLPLong")

if true
    if ConditionEntryL
        strategy.entry ("SLPLong",long=true)

if true
    if ConditionEntryS
        strategy.entry("SLPShort",long=false)
- Double K Crossbow Strategy
- Relative Body Index Crossover Strategy
- Multi-level Batch Take Profit BTC Robot Trading Strategy
- Dual Moving Average and RSI Reversal Trading Strategy
- Dual Moving Average Bollinger Band System Strategy
- Architecture Breakthrough Backtesting Strategy
- Breakout Strategy Based on Turtle Trading
- The DEMA Trend Following Strategy
- Algorithm RSI Range Breakout Strategy
- RSI Rising Crypto Trending Strategy
- TAM Intraday RSI Trading Strategy
- Exponential Moving Average Crossover Strategy
- Moving Average Crossover Strategy
- Tracking Breakout Strategy
- Dual Moving Average Monitoring Model
- Mean Reversion Strategy Based on ATR
- Relative Volume Trend Following Trading Strategy
- MACD Trend Balancing Strategy
- EMA and Heikin Ashi Trading Strategy
- Trend Following Long Only Strategy