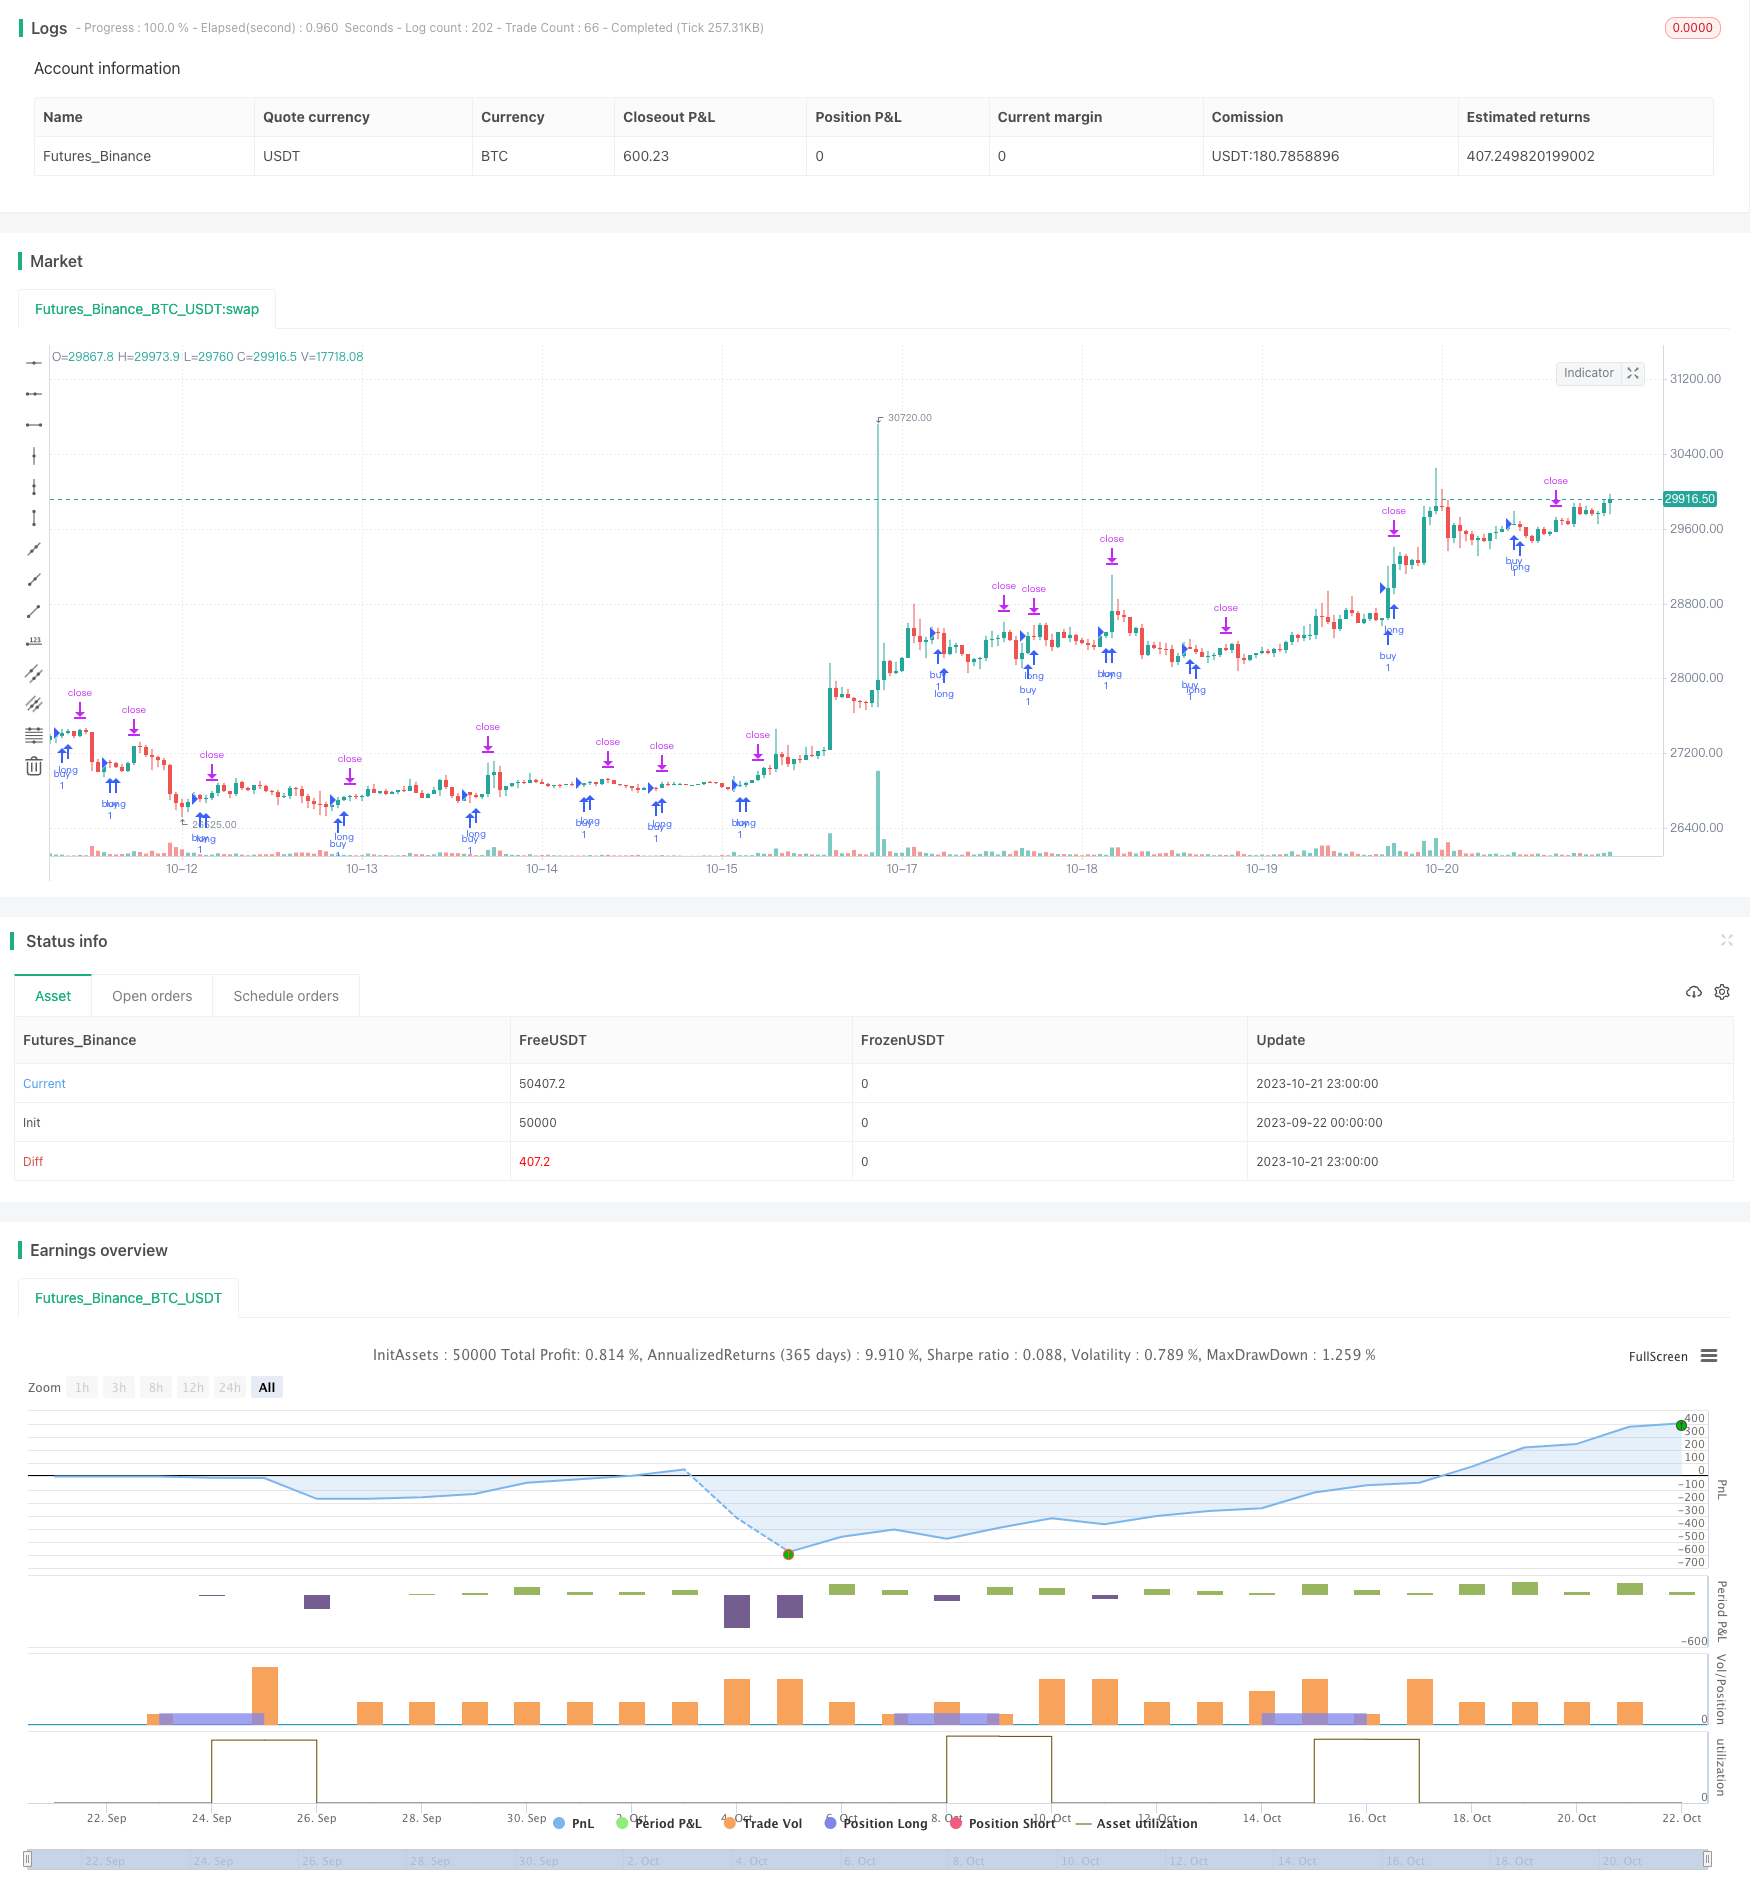
Momentum Breakout Strategy
Author: ChaoZhang, Date: 2023-10-23 15:17:45Tags:

Overview
This is a momentum breakout trading strategy based on K and D lines of Smoothed Stochastic Oscillator indicator. It uses crossover of K line into oversold area as buy signal and trailing stop as stop loss.
Strategy Logic
The strategy consists of following parts:
- Indicator Settings
Using 14-period RSI to generate K and D lines of Smoothed Stochastic Oscillator indicator, with 3-period SMA applied on K and D lines.
- Signal Generation
When K line crosses over 20 level, a buy signal is generated for long entry.
- Stop Loss
Trailing stop loss is used with fixed trailing stop distance. Also the lowest low in past 20 periods is used as stop loss price.
- Position Sizing
The number of points between stop loss price and current close is calculated using past 20-period lowest low. Then position size is calculated based on dollar amount at risk per trade and value per point.
This way, the strategy identifies momentum breakout on oversold reversal as entry signal, and adopts accurate position sizing and trailing stop loss to trade momentum reversal, with effective risk control.
Advantages
The strategy has following advantages:
Clear entry signal on breakout of overbought zone with strong momentum.
Flexible trailing stop moves with market swings.
Precise position sizing controls single trade risk.
Accurate stop loss based on historical low.
Simple and clear position sizing logic.
Simple and clear strategy logic, easy to understand.
Clean code structure, easy to read and modify.
Risks
There are some risks to the strategy:
Underlying price fluctuations. Frequent stop loss triggers during volatile market.
Potential over trading.
One directional holding, unable to profit from reverse price move.
Ineffective market condition filtering. Frequent stop loss triggers during ranging market.
Below optimisations can help manage the risks:
Optimize parameters to avoid over trading.
Use staged entries to lower one directional risk.
Add analysis of larger time frame trend to avoid trading in unfavourable market conditions.
Optimise stop loss strategy to prevent excessive sensitivity.
Optimization
Below aspects of the strategy can be optimized:
Optimise stop loss to use dynamic trailing stop, staged stop loss, moving average etc to make it more smooth.
Add analysis of larger time frame trend to avoid trading in sideways markets. Can incorporate trend analysis with moving averages, channel breakouts etc.
Consider two directional holdings to profit from pullbacks.
Use machine learning for auto parameter optimization to find optimal parameters for changing market conditions.
Optimize position sizing by using fixed percentage, fixed capital etc to improve capital utilization.
Add more filters with indicators like volume, Bollinger Bands to improve quality of trading signals.
Summary
Overall this is a simple and clear momentum breakout strategy. It adopts a prudent stop loss approach to effectively control single trade risk. But optimizations are still needed to adapt the strategy better to specific market conditions, filter ineffective signals, and achieve a better balance between return and risk. Enhancing analysis of larger time frame trends and position sizing are important optimization directions for this strategy. In summary, as a basic momentum breakout strategy, it is still practical and worth researching further to adapt it to the market conditions of specific trading instruments.
//@version=2
//descripcion:
//entrada en saturacion oscilador estocastico
//salida por trailing
strategy("MomentumBreak#1", overlay=true,calc_on_every_tick=true,
     default_qty_type=strategy.fixed,currency="USD")
//entradas y variables de indicadores
smoothK = input(3, minval=1)
smoothD = input(3, minval=1)
lengthRSI = input(14, minval=1)
lengthStoch = input(14, minval=1)
src = input(close, title="RSI Source")
rsi1 = rsi(src, lengthRSI)
k = sma(stoch(rsi1, rsi1, rsi1, lengthStoch), smoothK)
d = sma(k, smoothD)
overbought=input(80)
oversold=input(20)
//entradas de stop , trail, profit
stop=input(1500)
stop_dentro_de_los_ultimos_lows=input(20)
trail_points=input(500)
trail_offset=input(100)
profit=input(1000)
riesgo_en_dolares=input(15)

//condicion de compra: k>80
buycondition=crossover(k,oversold)
//entrada a la posicion
posicionabierta=0
if year>2015
    if buycondition
        stoplow=lowest(stop_dentro_de_los_ultimos_lows)
        riesgo_en_pips = (close - stoplow)
        valor_del_pip = (riesgo_en_dolares / riesgo_en_pips)
        tamanio_de_la_posicion= ( valor_del_pip)              //la posicion la esta calculando bien
        strategy.entry("buy",strategy.long)
        strategy.exit("salida","buy",trail_points=trail_points,trail_offset=trail_offset,stop=stoplow,comment=tostring(stoplow))

//////////////////////////////////condicion de stop por drodown 10% equity
//strategy.risk.max_drawdown(15,strategy.cash)
// condicion de stop por perdida mayor a $15 en op abierta
//strategy.risk.max_intraday_loss(15,strategy.cash)
//formas de tomar stop:
// cuando llega a una media movil: strategy.close o strategyentry o strategy.exit o strategy.order
// determinado por un numero de pips strategy.exit
// determinado por el calculo de la posicion:
//tomar el minimo minimo de los ultimos 20 periodos, guardarlo como nivel de stop
//calcular la posicion en base a ese stop:
//prcio de entrada - precio de stop = pips_en-reisgo
//riesgo_e_dolares / pips_en_riesgo = pip_value
//position_size=10000 * pip_value
- Trend Reversal System
- Channel Breakout SMA Strategy
- RSI Trend Reversal Strategy
- RSI MACD Crossover Double MA Tracking Strategy
- Multiple Timeframe Trend Strategy
- The Dual RSI Mean Reversion Strategy
- Heikin Ashi ROC Percentile Trading Strategy
- Trend Breakout Strategy Based on Moving Average Deviation
- Snap Back Moving Average Counter-trend Strategy
- Moving Average Trend Following Golden Cross Long Strategy
- Open Drive Strategy
- Momentum Reversal Combo Strategy
- Crossover Master - Reversal Breakout Strategy
- Ichimoku Lagging Cross Dual Line Trading Strategy
- Momentum Breakdown MACD Strategy
- Moving Average Tracking Strategy
- Oscillation Balance Strategy
- Trend Following Strategy with Moving Averages and SuperTrend
- Momentum Dual Moving Average Crossover Strategy
- Zigzag Breakout Strategy