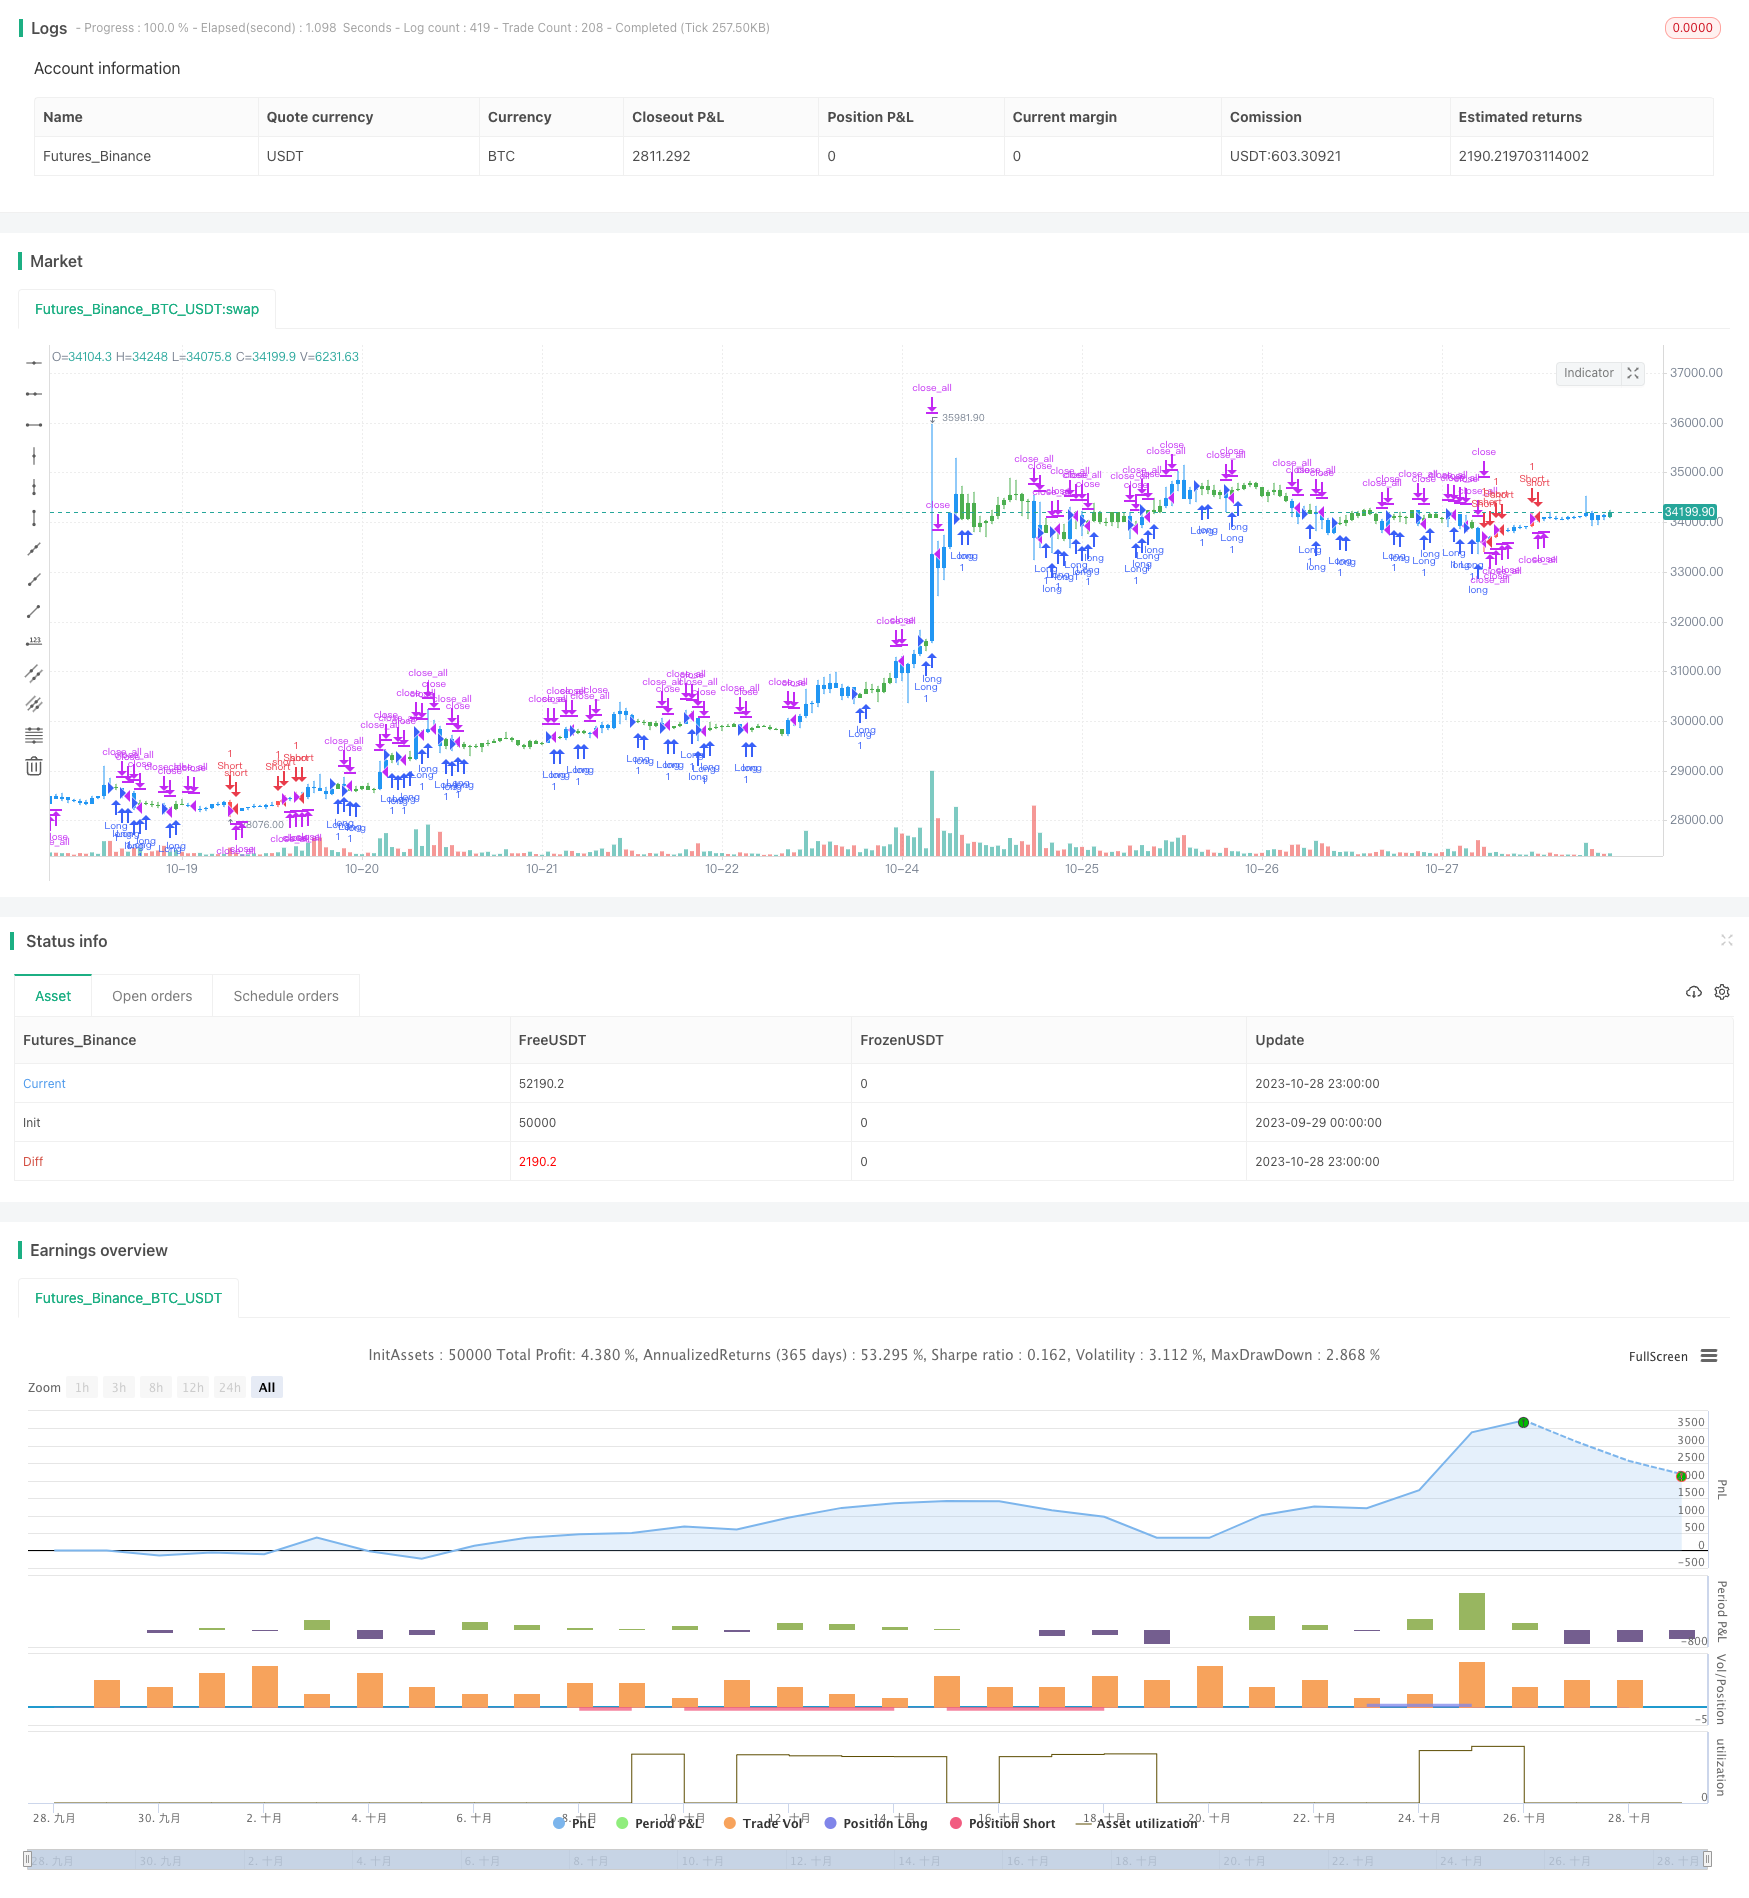
Overview
This strategy combines momentum indicators across different timeframes to identify trend reversal at multiple time scales. It uses the Stochastic oscillator to spot short-term reversals and the (Highest-Lowest)/Close indicator for medium-to-long term trends, enabling reversal detection in multiple time dimensions.
Strategy Logic
The strategy consists of two components:
- 123 Reversal
It uses Stochastic fast line crossing below slow line along with price reversal patterns to identify short-term trend reversals. Specifically, it goes long when price closes higher than previous close and Stochastic fast line crosses below slow line and below 50; it goes short when price closes lower than previous close and Stochastic fast line crosses above slow line and above 50. This part aims to capture mean-reversion setups based on overbought/oversold readings.
- (Highest-Lowest)/Close Indicator
This indicator measures the volatility of the current bar. Higher values suggest increased volatility and potential reversals, while lower values indicate decreased volatility and trend continuation. The strategy uses SMA of this indicator to identify medium-to-long term trend reversals.
Combined together, the two components enable the strategy to detect reversals across short and medium-to-long timeframes.
Advantages
- Improved accuracy with multi-timeframe indicators
Using both short and medium-to-long term indicators ensures signal reliability and avoids false signals.
- Flexible indicator parameters
Parameters of both Stochastic and (H-L)/C can be adjusted for market regimes, making the strategy robust.
- Simple and intuitive logic
With Stochastic as the core and a trend filter, the framework is simple and easy to understand.
- Extensibility
The simple framework allows easy incorporation of more indicators to build multifactor models.
Risks
- May underperform in persistent trend
The mean-reversion nature makes it less ideal for strong trending markets. Parameters could be tuned to adapt.
- Risk of false signals
Stochastic and (H-L)/C may give off wrong signals in abnormal markets. Risks of false signals need to be managed.
- Indicator tuning requires expertise
Parameters have to be optimized for changing markets, otherwise performance may suffer.
- Appropriate position sizing needed
As a reversal strategy, prudent risk management on position sizing is important.
Enhancement Opportunities
- More factors in multifactor model
Additional factors like volume, other reversal indicators can be added to create multifactor models.
- Implement stop loss
Stop loss on time or moving basis could help control single trade loss.
- Parameter optimization
More systematic parameter tuning methods like genetic algorithms can be explored.
- Machine learning
ML algorithms may help improve reversal prediction accuracy.
- Sentiment analysis
Incorporating alternative data like social sentiment could assist in predicting reversals.
Conclusion
This strategy combines short and medium-term indicators to identify reversals across timeframes. It has advantages like flexible parameters, simple structure, extensibility. Next steps could include more factors, stop loss, parameter optimization, machine learning to further improve profitability and risk management. Overall, this is an innovative strategy worth researching and applying.
//@version=3
////////////////////////////////////////////////////////////
//  Copyright by HPotter v1.0 23/05/2019
// This is combo strategies for get
// a cumulative signal. Result signal will return 1 if two strategies
// is long, -1 if all strategies is short and 0 if signals of strategies is not equal.
//
// First strategy
// This System was created from the Book "How I Tripled My Money In The
// Futures Market" by Ulf Jensen, Page 183. This is reverse type of strategies.
// The strategy buys at market, if close price is higher than the previous close
// during 2 days and the meaning of 9-days Stochastic Slow Oscillator is lower than 50.
// The strategy sells at market, if close price is lower than the previous close price
// during 2 days and the meaning of 9-days Stochastic Fast Oscillator is higher than 50.
//
// Second strategy
//  This histogram displays (high-low)/close
//  Can be applied to any time frame.
//
// WARNING:
// - For purpose educate only
// - This script to change bars colors.
////////////////////////////////////////////////////////////
Reversal123(Length, KSmoothing, DLength, Level) =>
    vFast = sma(stoch(close, high, low, Length), KSmoothing)
    vSlow = sma(vFast, DLength)
    pos = 0.0
    pos := iff(close[2] < close[1] and close > close[1] and vFast < vSlow and vFast > Level, 1,
	         iff(close[2] > close[1] and close < close[1] and vFast > vSlow and vFast < Level, -1, nz(pos[1], 0)))
	pos

HLCHist(input_barsback, input_percentorprice, input_smalength) =>
    xPrice = (high-low)/close
    xPriceHL = (high-low)
    xPrice1 = iff(input_percentorprice, xPrice * 100, xPriceHL)
    xPrice1SMA = sma(abs(xPrice1), input_smalength)
    pos = 0.0
    pos := iff(xPrice1SMA[input_barsback] > abs(xPrice1), 1,
    	   iff(xPrice1SMA[input_barsback] < abs(xPrice1), -1, nz(pos[1], 0)))
    pos

strategy(title="Combo Backtest 123 Reversal & (H-L)/C Histogram", shorttitle="Combo", overlay = true)
Length = input(14, minval=1)
KSmoothing = input(1, minval=1)
DLength = input(3, minval=1)
Level = input(50, minval=1)
//-------------------------
input_barsback = input(4, title="Look Back")
input_percentorprice = input(false, title="% change")
input_smalength = input(13, title="SMA Length")
reverse = input(false, title="Trade reverse")
posReversal123 = Reversal123(Length, KSmoothing, DLength, Level)
posHLCHist = HLCHist(input_barsback, input_percentorprice, input_smalength)
pos = iff(posReversal123 == 1 and posHLCHist == 1 , 1,
	   iff(posReversal123 == -1 and posHLCHist == -1, -1, 0))
possig = iff(reverse and pos == 1, -1,
          iff(reverse and pos == -1, 1, pos))
if (possig == 1)
    strategy.entry("Long", strategy.long)
if (possig == -1)
    strategy.entry("Short", strategy.short)
if (possig == 0)
    strategy.close_all()
barcolor(possig == -1 ? red: possig == 1 ? green : blue )