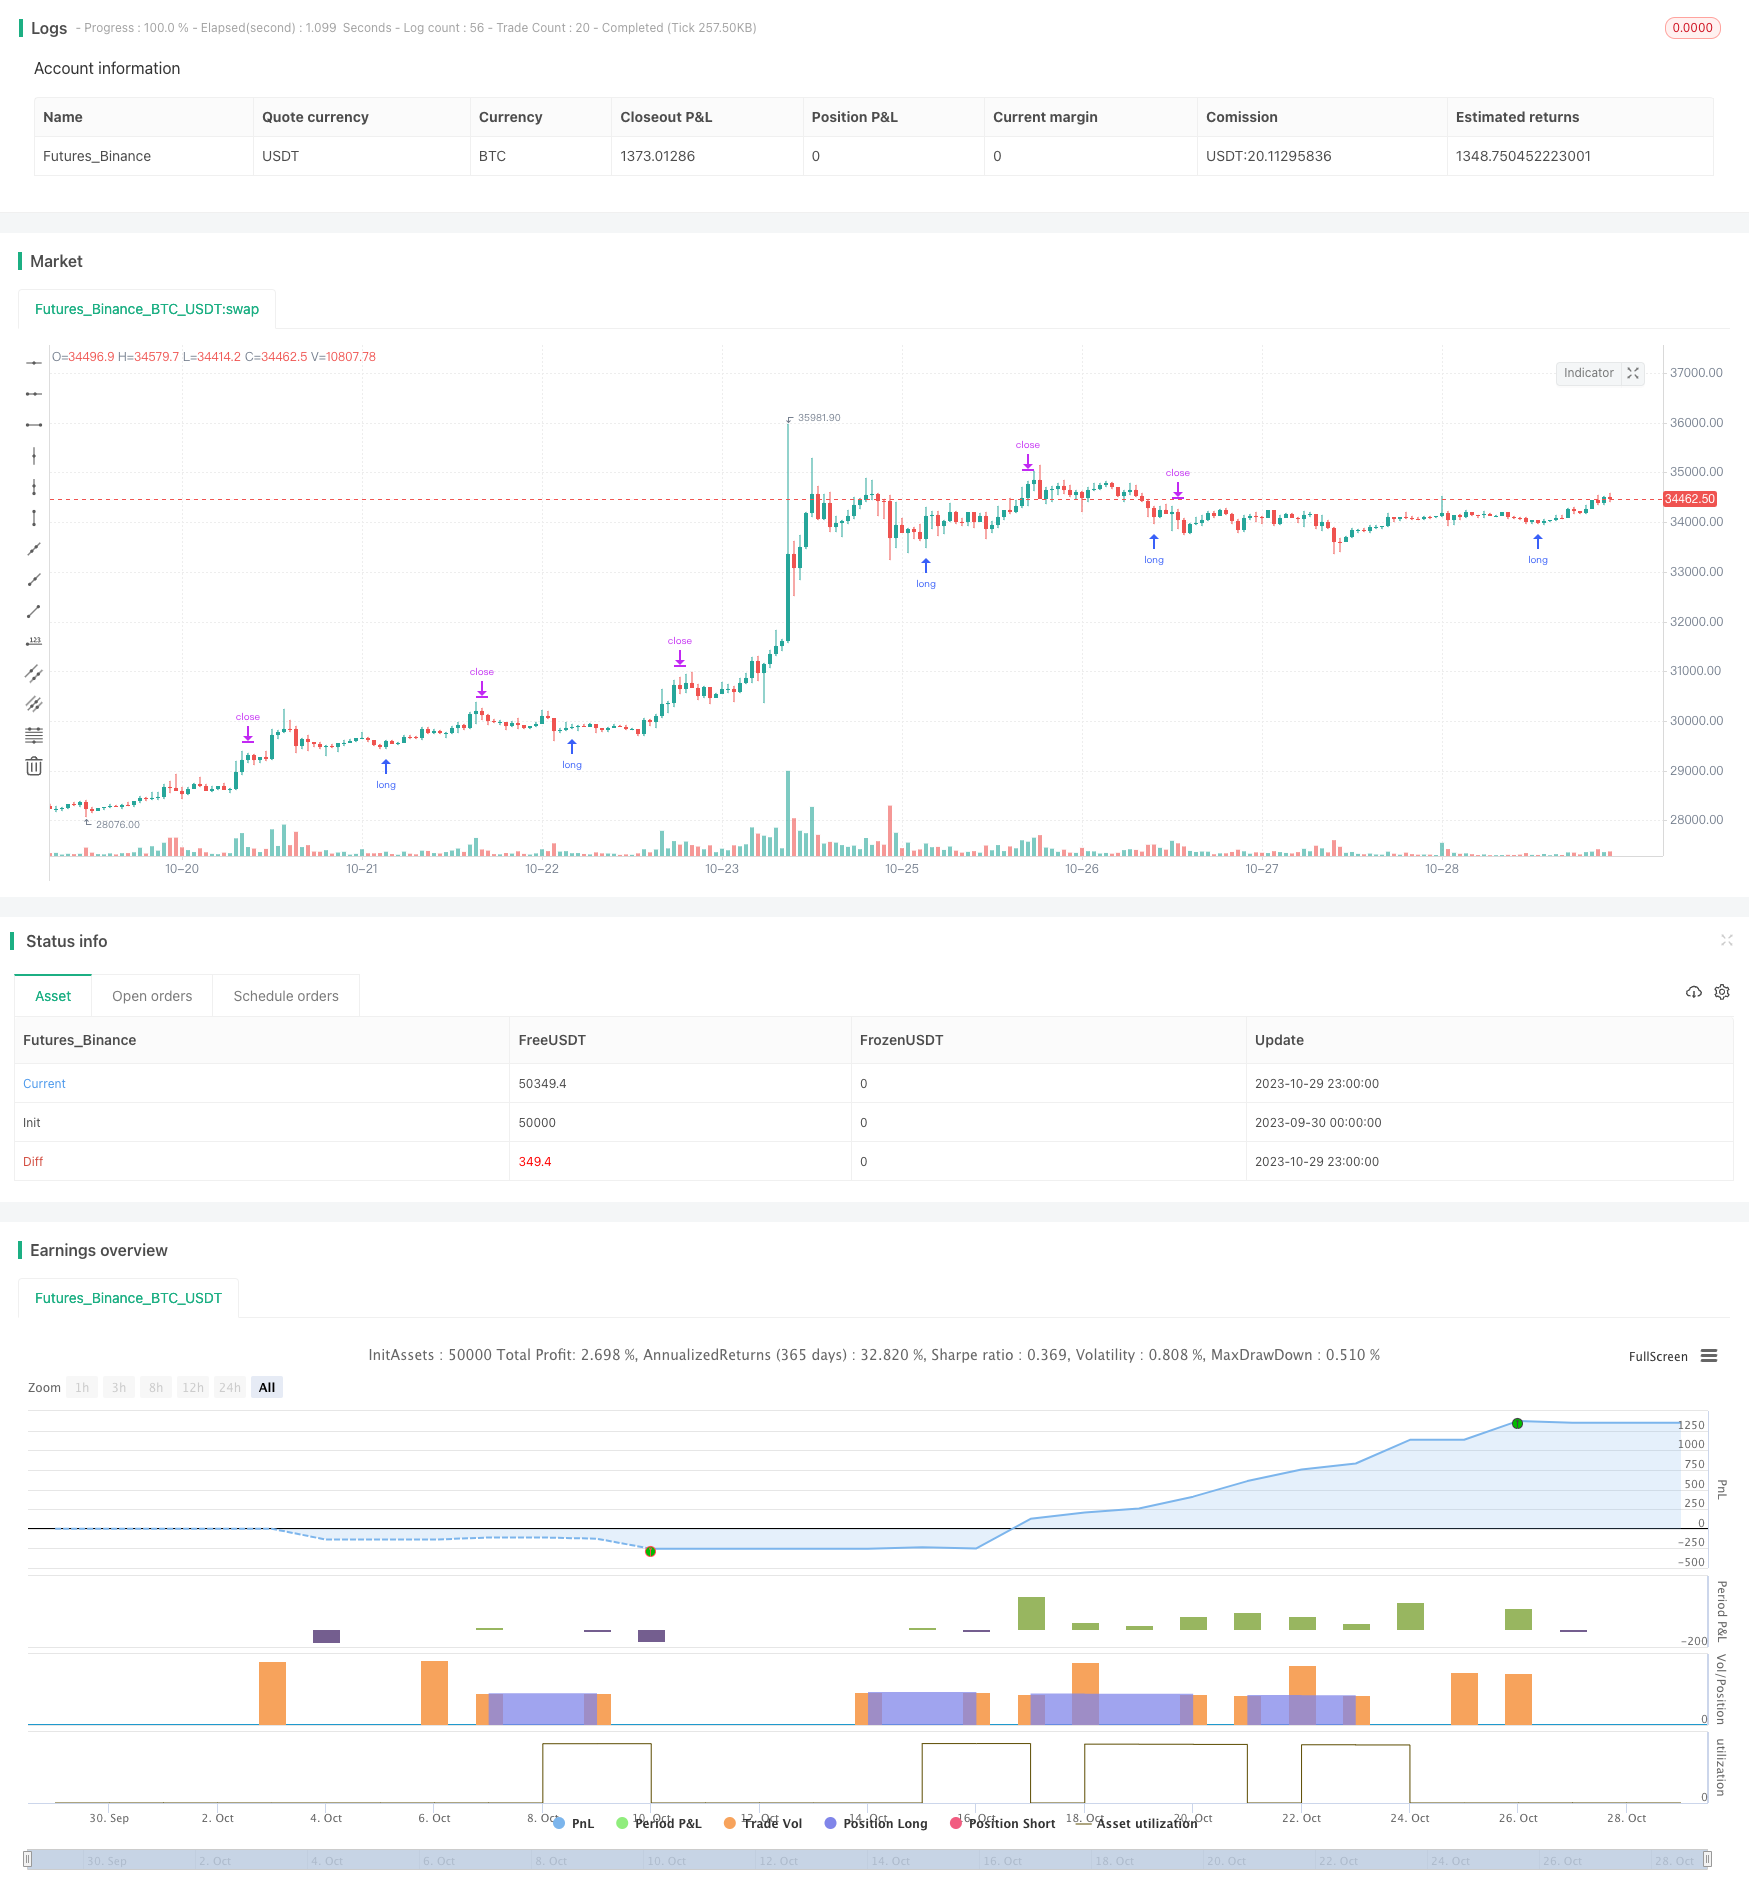
Variance Reversion Trading Strategy
Author: ChaoZhang, Date: 2023-10-31 14:42:13Tags:

Overview
The Variance Reversion trading strategy generates trading signals by calculating the ratio between call and put options, also known as the call put ratio. When the ratio reverses, it triggers trades combined with simple money management rules to realize profits. It is suitable for 30-minute periods of NDX and SPX. The oscillation needs to be fine-tuned to reflect the correct reversal point. Solid backtesting results indicate the optimal reversal point.
Strategy Logic
The core metrics of this strategy are the moving average and standard deviation of the call/put ratio. It first calculates the 20-day moving average of the call/put ratio, then computes the 30-day standard deviation of the ratio. A long signal triggers when the ratio crosses above the moving average plus 1.5 standard deviation. A short signal triggers when the ratio falls below the moving average minus 1.5 standard deviation.
After going long, if the ratio rebounds back above the moving average, close out the short position. The stop loss is set at 1% below the entry price. Take profit is set at 3 times the stop loss distance from the entry price.
Advantage Analysis
The biggest edge of this strategy is capturing sentiment reversal points when the market becomes overly pessimistic or bullish, causing anomalies in the call/put ratio. Trading against such anomalies can profit from local reversals. The money management rules effectively limit the risk and reward of individual trades.
Risk Analysis
The major risk comes from improper parameter tuning. Overly frequent signals fail to capture significant reversals. Reversal signals may also be faked out by false breakouts, causing losses. Parameters should be optimized for more reliable signals.
Optimization
Consider adding filters to confirm reversal signals and avoid false breakouts. For example, only consider signals when volume amplifies. Trend filters could also avoid countertrend trades. Optimal parameters likely vary across different markets and time frames. Integrating more factors will make the strategy more robust.
Conclusion
This strategy aims to capture market reversal points by using the call/put ratio with basic money management rules. It can profit from local reversals but faces false breakout risks. Optimizing parameters, adding filters and integrating more factors can enhance its stability and profitability. Overall, it provides a direction to trade reversals based on market sentiment. Further testing and optimization is needed for real-world application.
/*backtest
start: 2023-09-30 00:00:00
end: 2023-10-30 00:00:00
period: 1h
basePeriod: 15m
exchanges: [{"eid":"Futures_Binance","currency":"BTC_USDT"}]
*/

// This source code is subject to the terms of the Mozilla Public License 2.0 at https://mozilla.org/MPL/2.0/
// © I11L

//@version=5
strategy("I11L Long Put/Call Ratio Inversion", overlay=false, pyramiding=1, default_qty_value=10000, initial_capital=10000, default_qty_type=strategy.cash)

SL = input.float(0.01,step=0.01)
CRV = input.float(3)
TP = SL * CRV

len = input.int(30,"Lookback period in Days",step=10)
ratio_sma_lookback_len = input.int(20,step=10)
mult = input.float(1.5,"Standard Deviation Multiple")

ratio_sma = ta.sma(request.security("USI:PCC","D",close),ratio_sma_lookback_len)

median = ta.sma(ratio_sma,len)
standartDeviation = ta.stdev(ratio_sma,len)
upperDeviation = median + mult*standartDeviation
lowerDeviation = median - mult*standartDeviation


isBuy = ta.crossunder(ratio_sma, upperDeviation)// and close < buyZone
isCloseShort = (ratio_sma > median and strategy.position_size < 0)
isSL = (strategy.position_avg_price * (1.0 - SL) > low and strategy.position_size > 0) or (strategy.position_avg_price * (1.0 + SL) < high and strategy.position_size < 0)
isSell = ta.crossover(ratio_sma,lowerDeviation)
isTP = strategy.position_avg_price * (1 + TP) < high

if(isBuy)
    strategy.entry("Long", strategy.long)

if(isCloseShort)
    strategy.exit("Close Short",limit=close)

if(isSL)
    strategy.exit("SL",limit=close)

if(isTP)
    strategy.exit("TP",limit=close)

plot(ratio_sma,color=color.white)
plot(median,color=color.gray)
plot(upperDeviation,color=color.rgb(0,255,0,0))
plot(lowerDeviation,color=color.rgb(255,0,0,0))

bgcolor(isBuy?color.rgb(0,255,0,90):na)
bgcolor(isSell?color.rgb(255,0,0,90):na)
- SMI Ergodic Oscillator Momentum Trading Strategy
- trend following strategy based on Donchian Channels
- Rose Cross Star Dual Indicator Volatility Strategy
- Adaptive ATR Trend Breakout Strategy
- Bollinger Band Momentum Burst Strategy
- Multi-factor Strategy
- Golden Trend Tracking Strategy Based on Periodic Investment
- Ichimoku Kinko Hyo Cross Strategy
- Polygon Moving Average Strategy
- Pivot Detector Oscillator Trend Trading Strategy
- Trend Trading Strategy Based on EMA Crossover
- Bollinger Bands Reversal Oscillation Trend Strategy
- EMA and MAMA Indicators Based Trading Strategy
- Ehlers Leading Indicator Trading Strategy
- trend-following strategy based on moving averages
- Leledec DEC Strategy
- Stochastic RSI with Auto Buy Scalper Strategy
- Breakout Trading Strategy with Scalability
- Bollinger Bands and StochRSI Momentum Strategy
- RSI Long Short Automated Trading Strategy