Ichimoku Kinko Hyo Cross Strategy
Author: ChaoZhang, Date: 2023-10-31 15:00:43Tags:

Overview
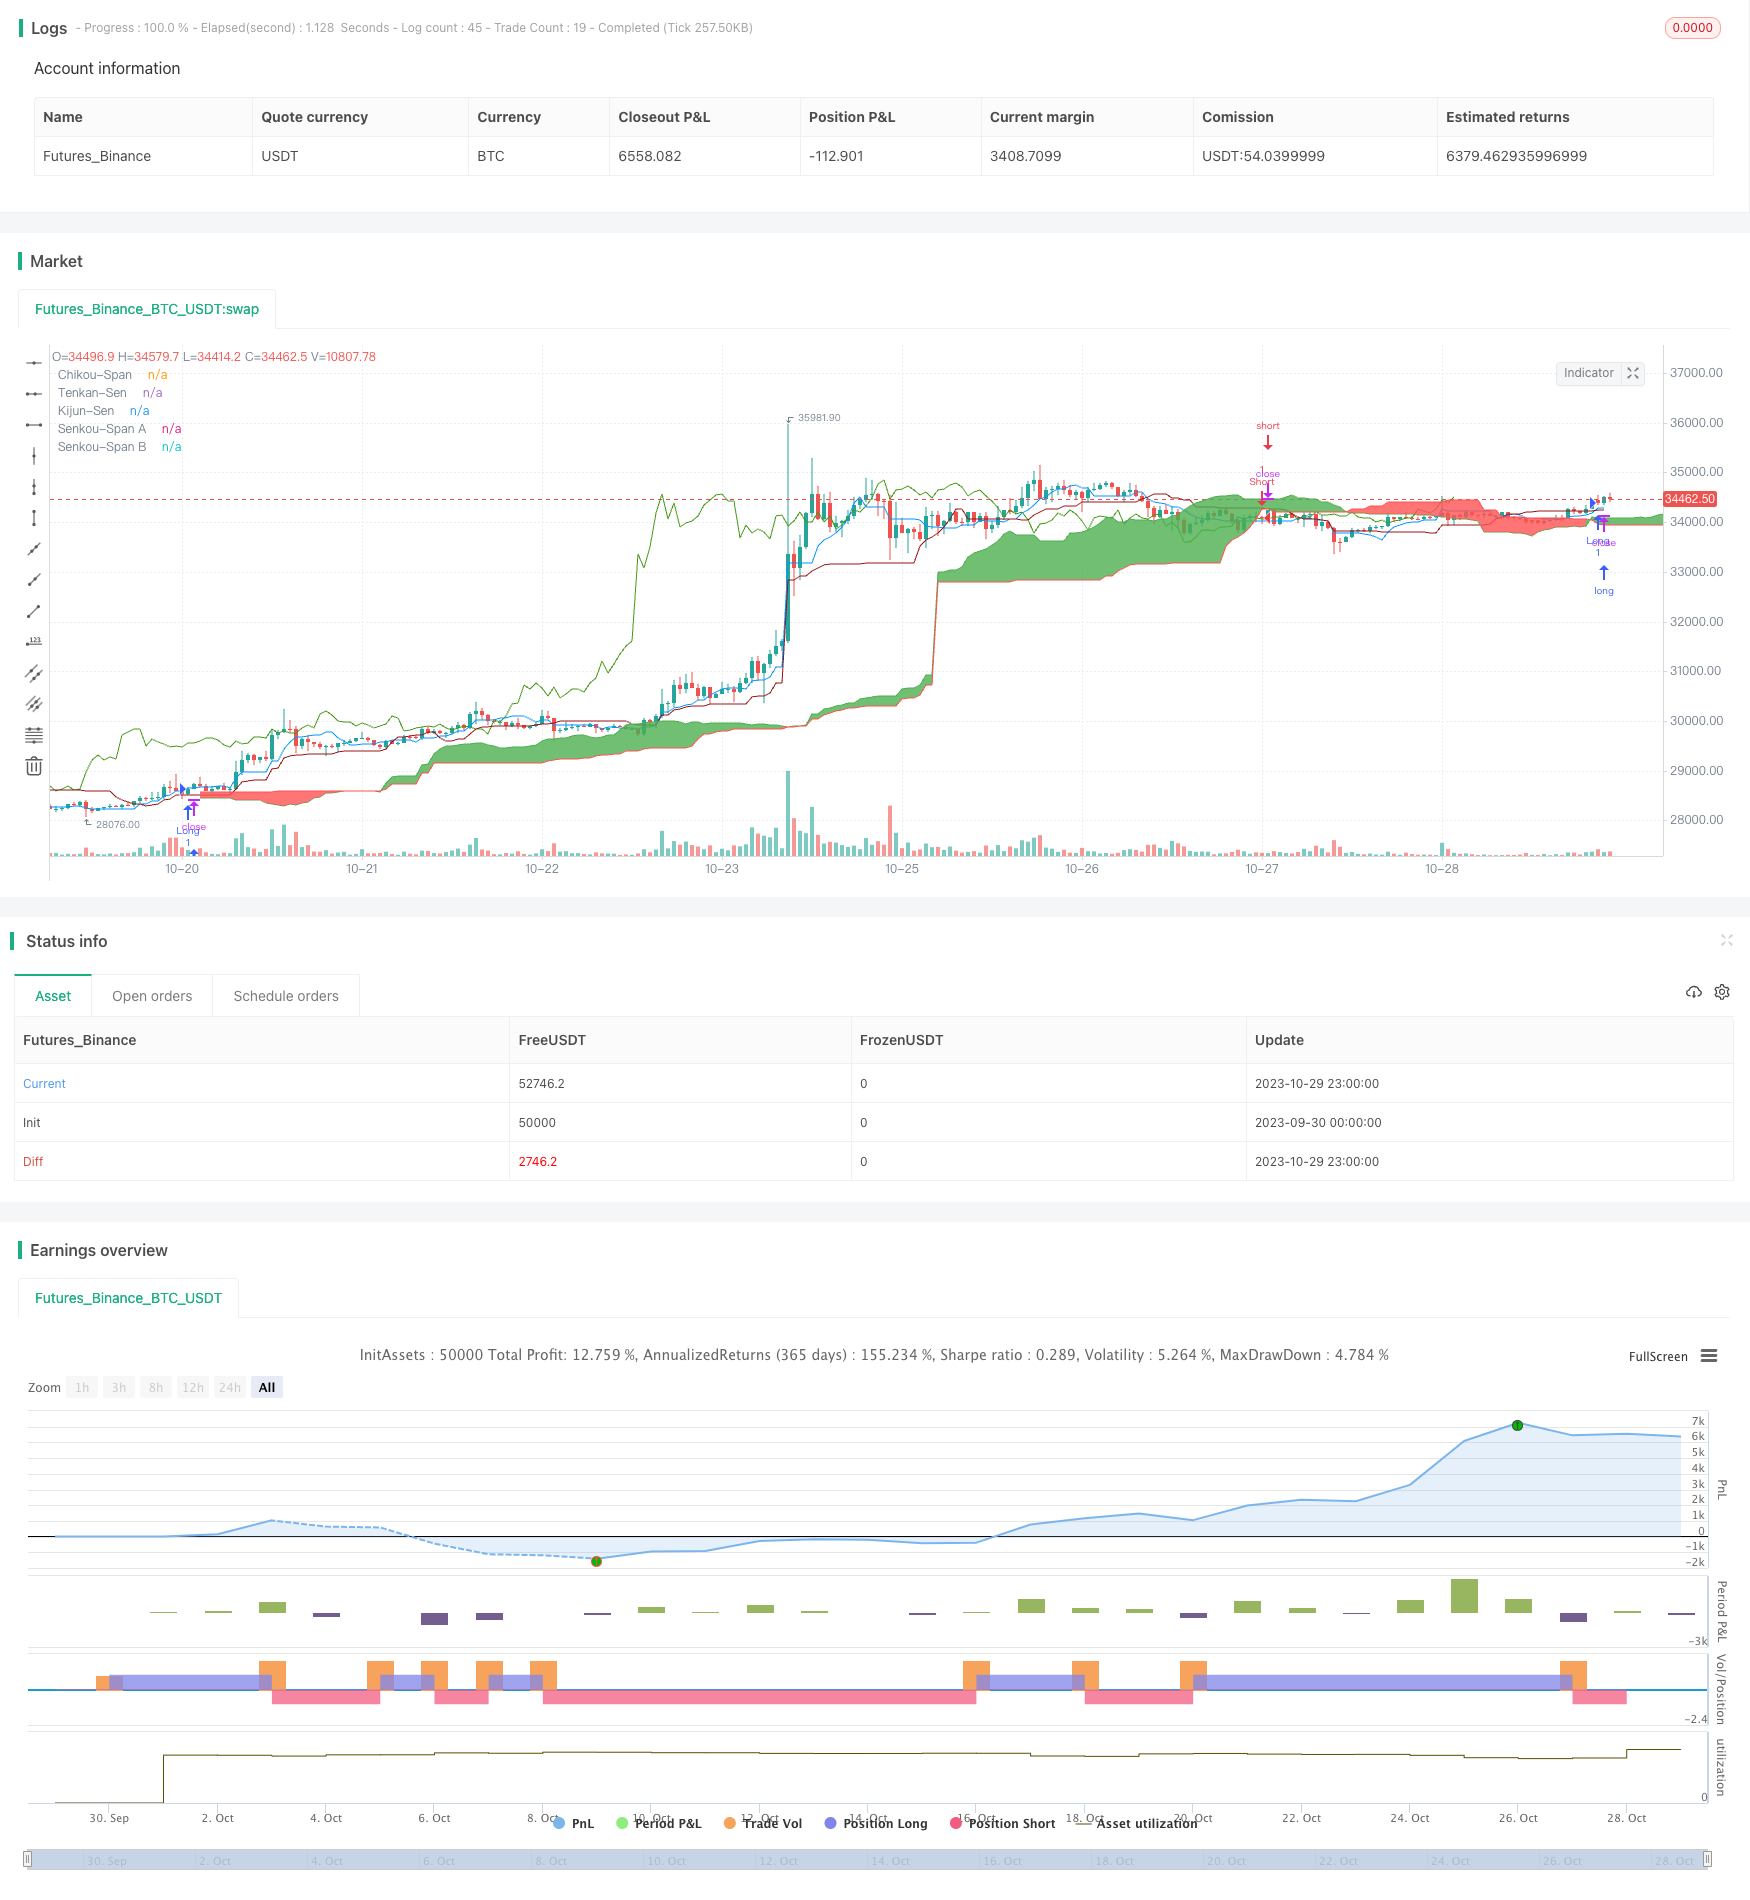
The Ichimoku Kinko Hyo Cross strategy generates trading signals by observing the crossovers between Tenkan-Sen and Kijun-Sen lines of the Ichimoku system, combined with the price level versus the Cloud. This strategy incorporates both trend following and reversal trading, making it a versatile and practical trading strategy.
Strategy Logic
Calculate the Ichimoku components:
Tenkan-Sen: Midpoint of last 9 bars
Kijun-Sen: Midpoint of last 26 bars
Senkou Span A: Average of Tenkan-Sen and Kijun-Sen
Senkou Span B: Midpoint of last 52 bars
Observe the combination of following trading signals:
Crossover between Tenkan-Sen and Kijun-Sen (Golden Cross and Death Cross)
Close price above or below the Cloud (Senkou Span A and B)
Chikou Span compared to close price 26 bars ago
Entry signals:
Long: Tenkan-Sen crosses above Kijun-Sen (Golden Cross) and close above Cloud and Chikou Span above close 26 bars ago
Short: Tenkan-Sen crosses below Kijun-Sen (Death Cross) and close below Cloud and Chikou Span below close 26 bars ago
Exit signals when opposite signal occurs.
Advantages
Combines trend following and reversal trading.
Crossovers ensure signal reliability and avoid false breakouts.
Multiple signal confirmation filters out market noise.
Chikou Span avoids whipsaws.
Cloud provides support and resistance for entries and exits.
Risks
Improper parameters may cause overtrading or unclear signals.
Trend reversals can lead to large losses.
Fewer trading opportunities during range-bound markets.
Delayed entry signals if Cloud is too wide.
High signal complexity increases implementation difficulty.
Risks can be mitigated through parameter optimization, position sizing, stop losses, liquid products, etc.
Enhancements
Optimize moving average periods for ideal frequency and profitability.
Add trend filter to avoid trend reversal losses.
Add volatility filter to control risk.
Optimize entry size and stop loss placement.
Add volume filter to ensure liquidity.
Test parameters across different products.
Employ machine learning to auto-optimize parameters based on backtests.
Conclusion
The Ichimoku Kinko Hyo Cross strategy combines various technical analysis tools like moving average crossovers, delayed lines, and Cloud bands to identify high-probability entries in trending or reversal scenarios. Proper optimization and risk management can further improve its stability and profitability. The strategy is easy to understand and implement, making it worth live testing and application.
/*backtest
start: 2023-09-30 00:00:00
end: 2023-10-30 00:00:00
period: 1h
basePeriod: 15m
exchanges: [{"eid":"Futures_Binance","currency":"BTC_USDT"}]
*/

//@version=4
strategy("Ichimoku Kinko Hyo: Basic Strategy", overlay=true)

//Inputs
ts_bars = input(9, minval=1, title="Tenkan-Sen Bars")
ks_bars = input(26, minval=1, title="Kijun-Sen Bars")
ssb_bars = input(52, minval=1, title="Senkou-Span B Bars")
cs_offset = input(26, minval=1, title="Chikou-Span Offset")
ss_offset = input(26, minval=1, title="Senkou-Span Offset")
long_entry = input(true, title="Long Entry")
short_entry = input(true, title="Short Entry")

middle(len) => avg(lowest(len), highest(len))

// Ichimoku Components
tenkan = middle(ts_bars)
kijun = middle(ks_bars)
senkouA = avg(tenkan, kijun)
senkouB = middle(ssb_bars)

// Plot Ichimoku Kinko Hyo
plot(tenkan, color=#0496ff, title="Tenkan-Sen")
plot(kijun, color=#991515, title="Kijun-Sen")
plot(close, offset=-cs_offset+1, color=#459915, title="Chikou-Span")
sa=plot(senkouA, offset=ss_offset-1, color=green, title="Senkou-Span A")
sb=plot(senkouB, offset=ss_offset-1, color=red, title="Senkou-Span B")
fill(sa, sb, color = senkouA > senkouB ? green : red, title="Cloud color")

ss_high = max(senkouA[ss_offset-1], senkouB[ss_offset-1])
ss_low = min(senkouA[ss_offset-1], senkouB[ss_offset-1])

// Entry/Exit Signals
tk_cross_bull = tenkan > kijun
tk_cross_bear = tenkan < kijun
cs_cross_bull = mom(close, cs_offset-1) > 0
cs_cross_bear = mom(close, cs_offset-1) < 0
price_above_kumo = close > ss_high
price_below_kumo = close < ss_low

bullish = tk_cross_bull and cs_cross_bull and price_above_kumo
bearish = tk_cross_bear and cs_cross_bear and price_below_kumo

strategy.entry("Long", strategy.long, when=bullish and long_entry)
strategy.entry("Short", strategy.short, when=bearish and short_entry)

strategy.close("Long", when=bearish and not short_entry)
strategy.close("Short", when=bullish and not long_entry)
- Dual ATR Channel Trend Following Strategy
- Bollinger Bands Trend Reversal Strategy
- Correlation-based Bullish/Bearish Crypto Trading Strategy Based on Wall Street CCI Index
- SMI Ergodic Oscillator Momentum Trading Strategy
- trend following strategy based on Donchian Channels
- Rose Cross Star Dual Indicator Volatility Strategy
- Adaptive ATR Trend Breakout Strategy
- Bollinger Band Momentum Burst Strategy
- Multi-factor Strategy
- Golden Trend Tracking Strategy Based on Periodic Investment
- Polygon Moving Average Strategy
- Pivot Detector Oscillator Trend Trading Strategy
- Variance Reversion Trading Strategy
- Trend Trading Strategy Based on EMA Crossover
- Bollinger Bands Reversal Oscillation Trend Strategy
- EMA and MAMA Indicators Based Trading Strategy
- Ehlers Leading Indicator Trading Strategy
- trend-following strategy based on moving averages
- Leledec DEC Strategy
- Stochastic RSI with Auto Buy Scalper Strategy