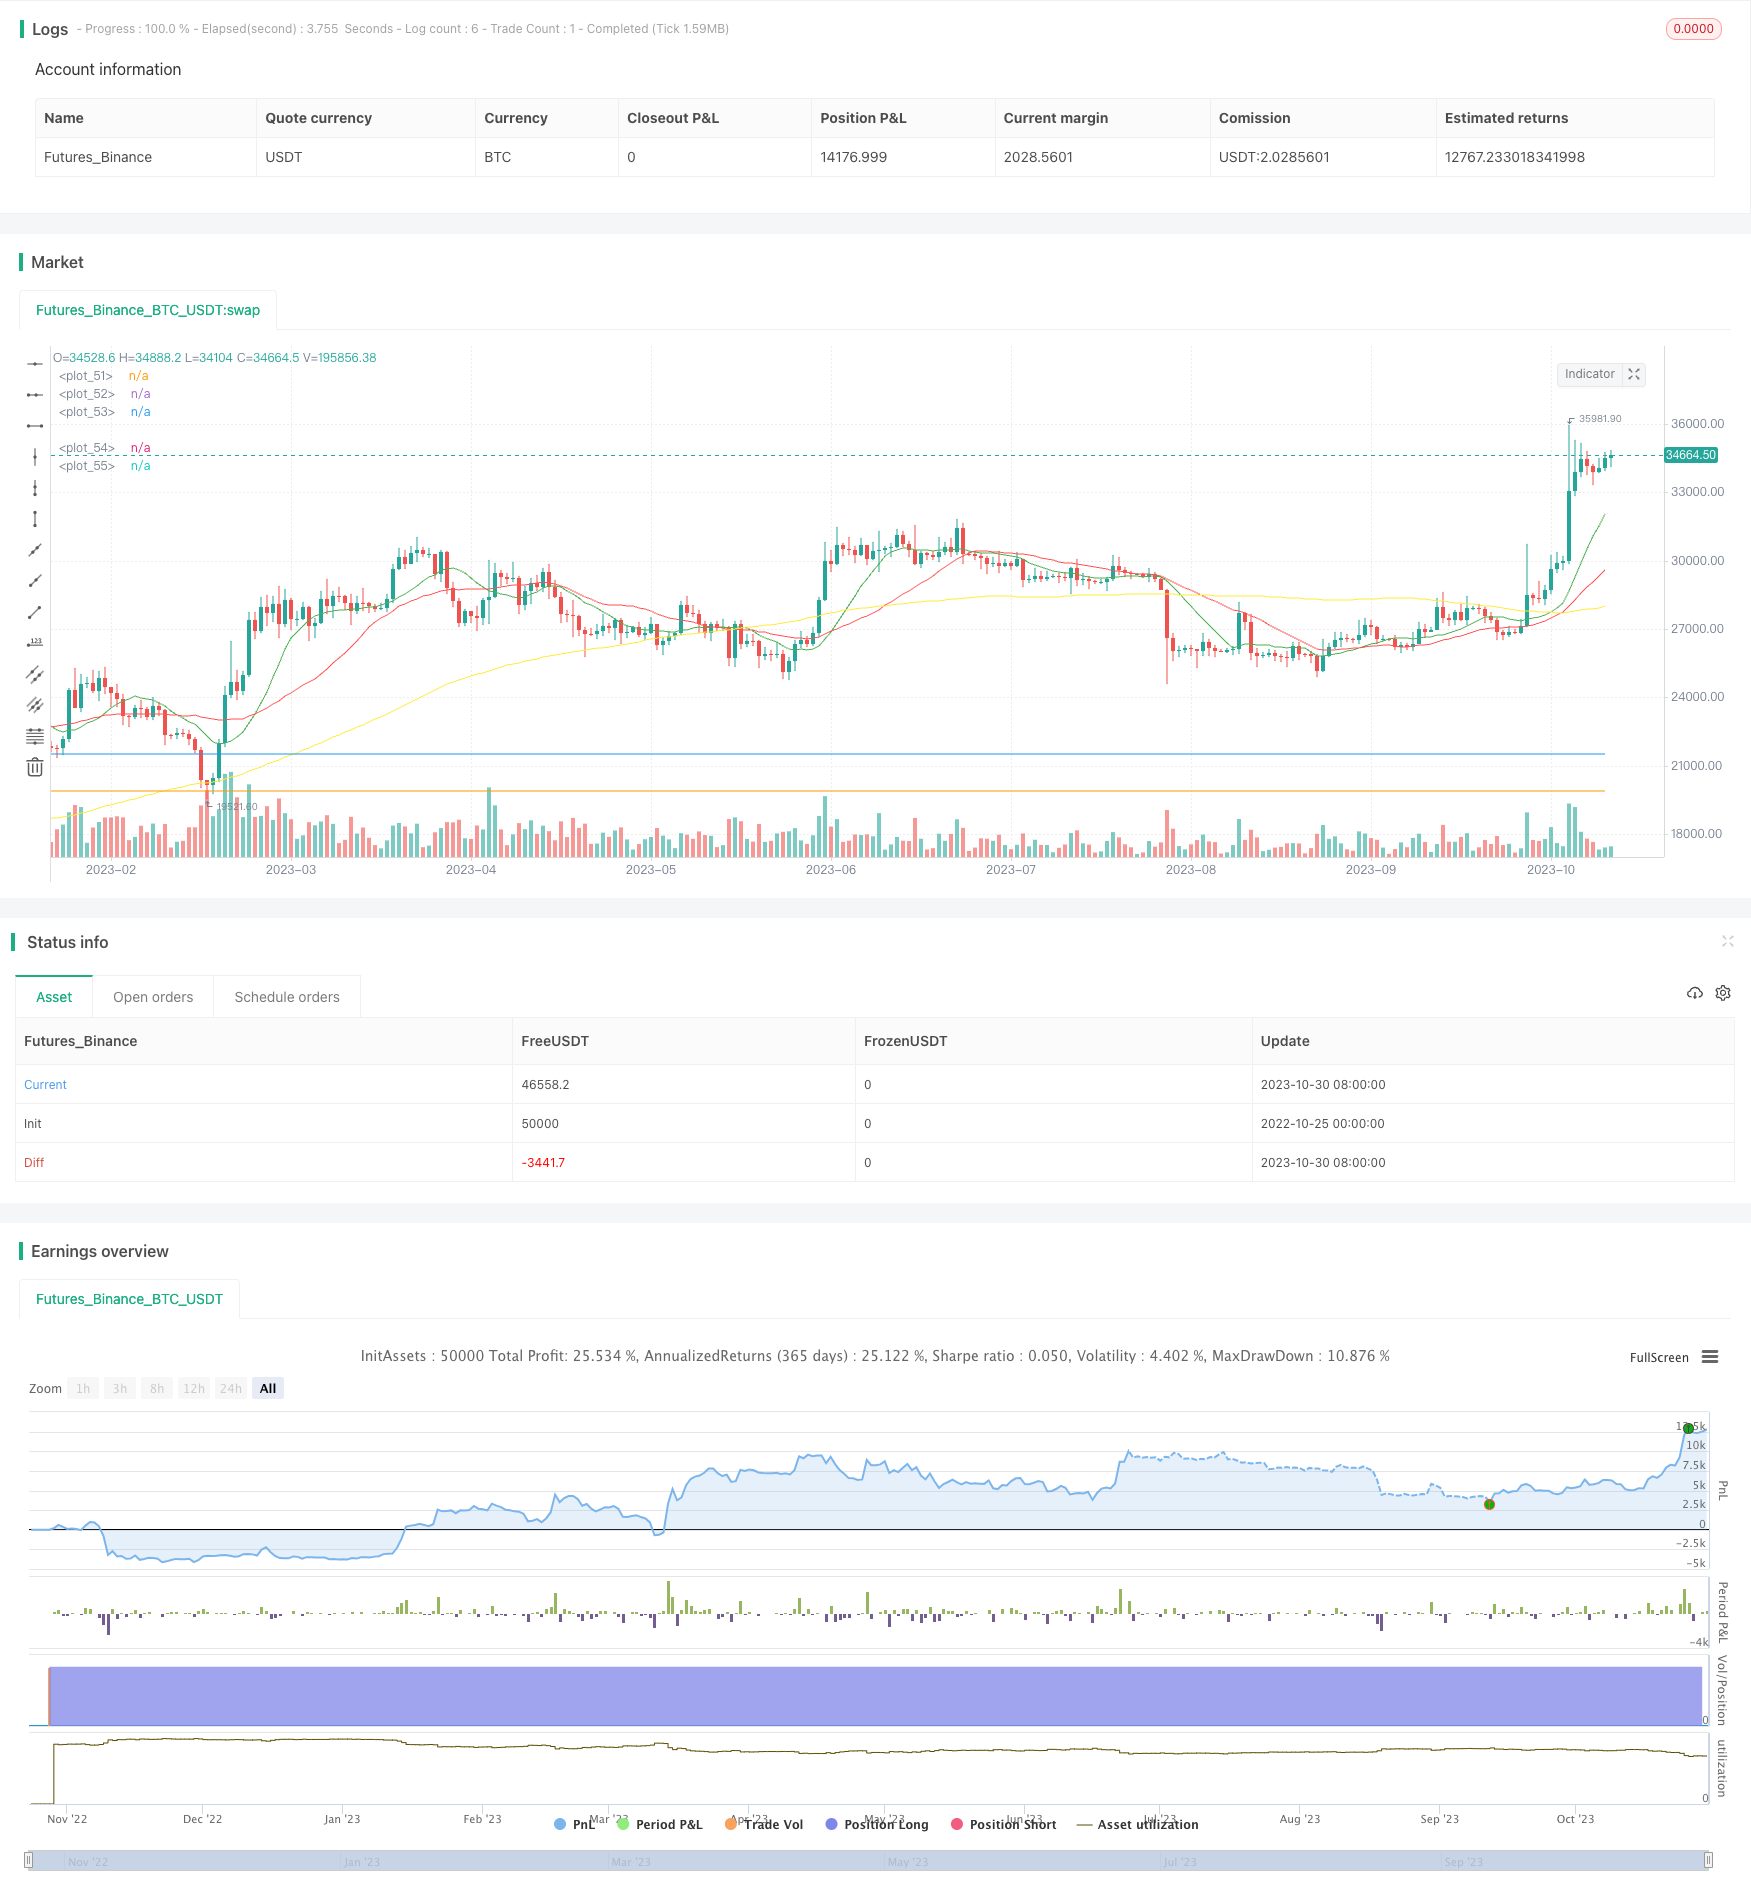
Momentum Breakout Moving Average Trading Strategy
Author: ChaoZhang, Date: 2023-11-01 17:13:40Tags:

Overview
This strategy generates trading signals for low volatility stocks by combining moving averages, MACD indicator and candlestick patterns. It can print buy or sell signals to alert when certain conditions are met. I use it as a time saver to help identify which charts to look at. You can adjust the inputs and settings to suit your needs. I would suggest allowing two or three orders.
Strategy Logic
The strategy mainly uses three indicators for trade signal judgment:
Moving Averages: Calculates three moving averages - fast, slow and baseline, and generates buy signal when fast line crosses above slow line.
MACD Indicator: Calculates MACD histogram and signal line, generates buy signal when MACD histogram crosses above 0.
Candlestick Patterns: Calculates the percentage increase within a single candle, generates buy signal when increase exceeds a certain percentage, judging it as mark up by market makers.
For sell signals, the strategy sets a stop loss level and take profit level. It generates sell signal when price reaches stop loss level and take profit level.
Advantages
Combines three different types of technical indicators for mutual verification and avoids false signals.
Good liquidity, suitable for low volatility stocks. Moving averages identify mid-long term trends, MACD captures short term momentum, candlesticks identify market maker behaviors.
Sets stop loss and take profit conditions to lock in profits and prevent enlarged losses.
Simple and clear logic, easy to implement. Intuitive adjustable parameters, flexible adaptation to different market conditions.
Indicator parameters are optimized and tested for stability and profitability.
Risks
As a trend following strategy, ineffective in range-bound choppy markets, may produce frequent small gains/losses.
Candlestick patterns are subjective, difficult to accurately judge market maker behaviors, may generate some false signals.
Stop loss and take profit need to be adjusted for different stocks, too small may stop loss prematurely, too large may limit profits.
The strategy is relatively complex and needs to consider multiple indicators simultaneously, requiring high technical skills from traders. Parameters need continuous tracking and optimization.
Enhancement Directions
Add market condition judgment, follow trends in obvious trending phases, avoid trading during consolidations. Can add ATR etc. to assist.
Optimize moving average parameters, adjust periods to fit the stock’s characteristics. Experiment with different moving average types.
Introduce machine learning to model market maker behaviors, reduce false signals.
Develop dynamic stop loss and take profit strategies, instead of fixed settings.
Simplify the strategy by removing highly subjective indicators to reduce false signals. Can also consider averaging same type indicators to get more stable results.
Conclusion
This strategy integrates moving averages, MACD and market maker behavior judgment into a relatively complete low risk stock trading strategy. It has certain advantages but also some aspects that can be improved. Although complex, the technical requirement is not too demanding for traders. With continuous optimization and testing, this strategy can become a very practical quantitative trading tool. It provides a reference solution for short-mid term trading of low volatility stocks.
/*backtest
start: 2022-10-25 00:00:00
end: 2023-10-31 00:00:00
period: 1d
basePeriod: 1h
exchanges: [{"eid":"Futures_Binance","currency":"BTC_USDT"}]
*/

//@version=3
strategy("Simple Stock Strategy", overlay=true)

//Simple Trading Strategy for Stocks//
// by @ShanghaiCrypto //

////SMA////
fastLength = input(12)
slowLength = input(26)
baseLength = input(100)
price = close

mafast = sma(price, fastLength)
maslow = sma(price, slowLength)
mabase = sma(price, baseLength)

///MACD////
MACDLength = input(9)
MACDfast = input(12)
MACDslow = input(26)
MACD = ema(close, MACDfast) - ema(close, MACDslow)
aMACD = ema(MACD, MACDLength)
delta = MACD - aMACD

////PUMP////
OneCandleIncrease = input(6, title='Gain %')
pump = OneCandleIncrease/100

////Profit Capture and Stop Loss//////
stop = input(2.0, title='Stop Loss %', type=float)/100
profit = input(6.0, title='Profit %', type=float)/100
stop_level = strategy.position_avg_price * (1 - stop)
take_level = strategy.position_avg_price * (1 + profit)

////Entries/////
if crossover(mafast, maslow)
    strategy.entry("Cross", strategy.long, comment="BUY")

if (crossover(delta, 0))
    strategy.entry("MACD", strategy.long, comment="BUY")

if close > (open + open*pump)
    strategy.entry("Pump", strategy.long, comment="BUY")

/////Exits/////
strategy.exit("SELL","Cross", stop=stop_level, limit=take_level)
strategy.exit("SELL","MACD", stop=stop_level, limit=take_level)
strategy.exit("SELL","Pump", stop=stop_level, limit=take_level)

////Plots////
plot(mafast, color=green)
plot(maslow, color=red)
plot(mabase, color=yellow)
plot(take_level, color=blue)
plot(stop_level, color=orange)
- Dual Moving Average Crossover Trading Strategy
- Trend Line Trading Strategy
- Stochastic RSI and Volume Based Trading Strategy
- Multi-indicator Strategy to Identify Trading Inflection Points in Quant Trading
- ATR Trailing Stop Strategy (Long Only)
- Momentum Trading Strategy Based on Trend Tracking Stop Loss
- Dual Pressure Quantitative Trading Strategy
- WeChat, a social networking site, is a social networking site.
- Breakout Trend Follower V2
- Trend Following Moving Average Crossover Strategy
- Hull Moving Average and Kalman Filter Based Trend Tracking Strategy
- Golden Cross Trend Following Strategy
- Dual Oscillation Reversal Signal-to-Noise Ratio Optimization Combo Strategy
- Classic Dual Trend Tracking Strategy
- Dual Reversal Trading Strategy
- Bollinger Bands Oscillation Breakthrough Strategy
- Fibonacci Moving Averages Input Strategy
- MACD Dissipation and Multi Time Frame Moving Average Strategy
- Wealth Creation Composite Strategy
- Dollar Cost Averaging Investment Strategy