Moving Average Crossover Strategy
Author: ChaoZhang, Date: 2023-11-23 13:38:02Tags:

Overview
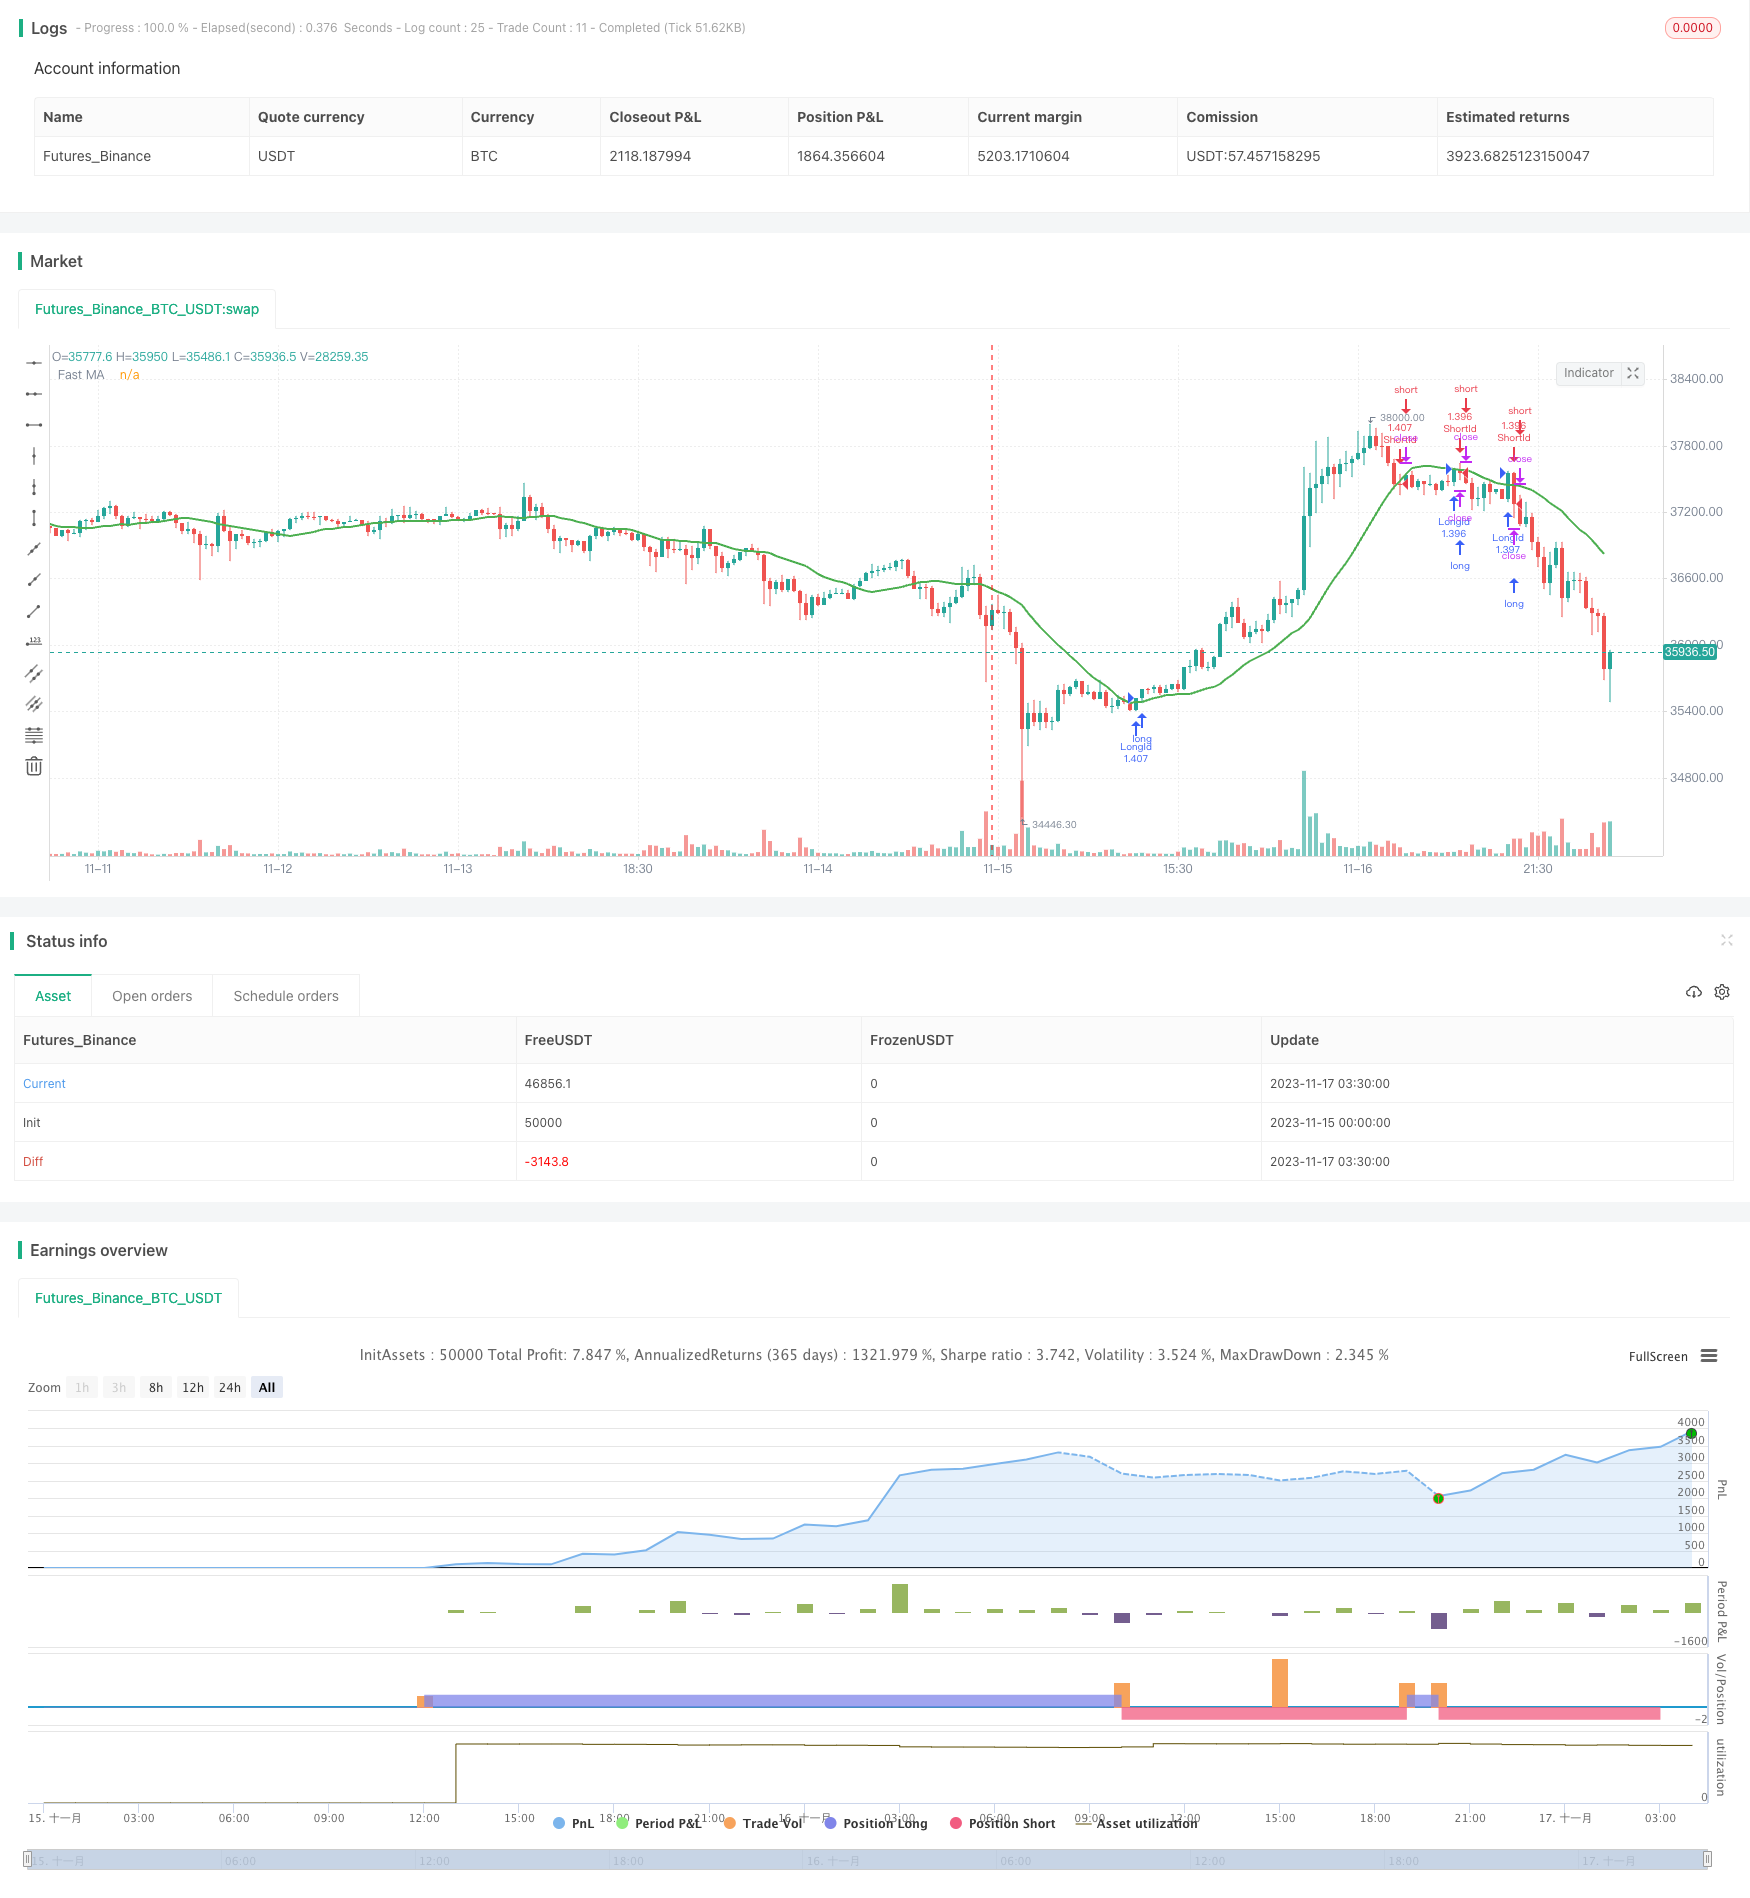
The moving average crossover strategy is a trading strategy based on moving averages. It uses the crossover of a fast moving average and a slow moving average as buy and sell signals. When the fast MA crosses above the slow MA from below, a buy signal is generated. When the fast MA crosses below the slow MA from above, a sell signal is generated.
Strategy Logic
The strategy uses the sma function to calculate simple moving averages of a specified period as the fast MA and slow MA. The default fast MA period is 18 days, which can be adjusted through parameters.
When the fast MA crosses above the slow MA from below, the crossunder function detects the crossover signal and generates a buy signal. When the fast MA crosses below the slow MA from above, the crossover function detects the crossover signal and generates a sell signal.
The strategy realizes automated trading through track signals and exit signals. Long entry triggers when the fast MA crosses above the slow MA, and short entry triggers when the fast MA crosses below the slow MA. The corresponding exit signals are also generated on reverse crossovers.
Advantage Analysis
- Moving averages have the ability to track trends effectively and catch price momentum
- MA strategies are simple and straightforward, easy to understand and implement
- Parameters can be optimized to adapt to different market environments
- The strategy automates trading without manual intervention, reducing trading costs
Risks and Solutions
- Price oscillations may cause multiple false signals and high trading frequency. Additional filters can avoid this.
- Parameter optimization is crucial and may significantly impact performance. Backtest optimization and adaptive MAs can help.
- There are risks of missing signals. Other indicators may be combined to filter or supplement trade signals.
- Stop loss can control single trade loss.
Optimization Directions
- Adaptive moving averages can be used to dynamically adjust MA parameters for better tracking.
- Additional filters, like trading volumes, can avoid false signals when trend is unclear.
- Combining other indicators like Bollinger Bands as filters or supplementary conditions can improve strategy performance.
- Stop loss strategy controls single trade loss within acceptable levels.
Conclusion
The MA crossover strategy is a classic and simple trend-following strategy. It mainly uses MA crossovers as trading signals with easy logic and implementation. It can be adapted through parameter tuning. But it also has drawbacks like susceptibility to oscillations and trend reversals, high signal frequency etc. These can be improved through filters, dynamic parameters, stop loss etc. The strategy has extensive optimization space and directions, and is one of the fundamental quantitative trading strategies.
/*backtest
start: 2023-11-15 00:00:00
end: 2023-11-17 04:00:00
period: 30m
basePeriod: 15m
exchanges: [{"eid":"Futures_Binance","currency":"BTC_USDT"}]
*/

//@version=3
strategy(title = "MA Close Strategy", shorttitle = "MA Close",calc_on_order_fills=true,calc_on_every_tick =true, initial_capital=21000,commission_value=.25,overlay = true,default_qty_type = strategy.percent_of_equity, default_qty_value = 100)

MASource   = input(defval = open, title = "MA Source")
MaLength   = input(defval = 18, title = "MA Period", minval = 1)

StartYear = input(2018, "Backtest Start Year")
StartMonth = input(1, "Backtest Start Month")
StartDay = input(1, "Backtest Start Day")
UseStopLoss = input(true,"UseStopLoss")
stopLoss = input(50, title = "Stop loss percentage(0.1%)")

window() => time >=  timestamp(StartYear, StartMonth, StartDay,00,00) ? true : false

MA = sma(MASource,MaLength)

plot(MA, title = "Fast MA", color = green, linewidth = 2, style = line, transp = 50)

long = crossunder(MA, close)
short = crossover(MA, close)

if (long)
    strategy.entry("LongId", strategy.long, when = long)
    strategy.exit("ExitLong", from_entry = "LongId", when = short)

if (short)
    strategy.entry("ShortId", strategy.short, when = short)
    strategy.exit("ExitShort", from_entry = "ShortId", when = long)

if (UseStopLoss)
    strategy.exit("StopLoss", "LongId", loss = close * stopLoss / 1000 / syminfo.mintick)
    strategy.exit("StopLoss", "ShortId", loss = close * stopLoss / 1000 / syminfo.mintick)
- Bi-Directional Trend Tracking Moving Average Crossover Strategy
- Personalized Momentum Trading Strategy
- Moving Average Envelop Channel Trend Following Strategy
- Momentum Combined with Trend Judgment Multi-factor Quantitative Trading Strategy
- Momentum Breakout Strategy Based on Internal Amplitude Stop Loss
- Trend Trading Strategy Based on Golden Cross
- Trend Tracking Strategy Based on Channel Breakouts
- Bollinger Break Out Strategy with Pyramiding
- Momentum Tracking Strategy
- CCTBBO Reversal Tracking Strategy
- Momentum Turtle Trend Tracking Strategy
- Bearish Harami Reversal Backtest Strategy
- Dynamic Moving Average Strategy
- Momentum Alpha Strategy
- Double VWAP Oscillation Breakthrough Strategy
- Low-High-Trend Strategy
- Cloud Soaring High Yield Daily Trading Strategy
- Bollinger Trend Shock Trading Strategy
- Dynamic Price Swing Oscillator Strategy
- Dual Rate of Change Momentum Indicator Trading Strategy