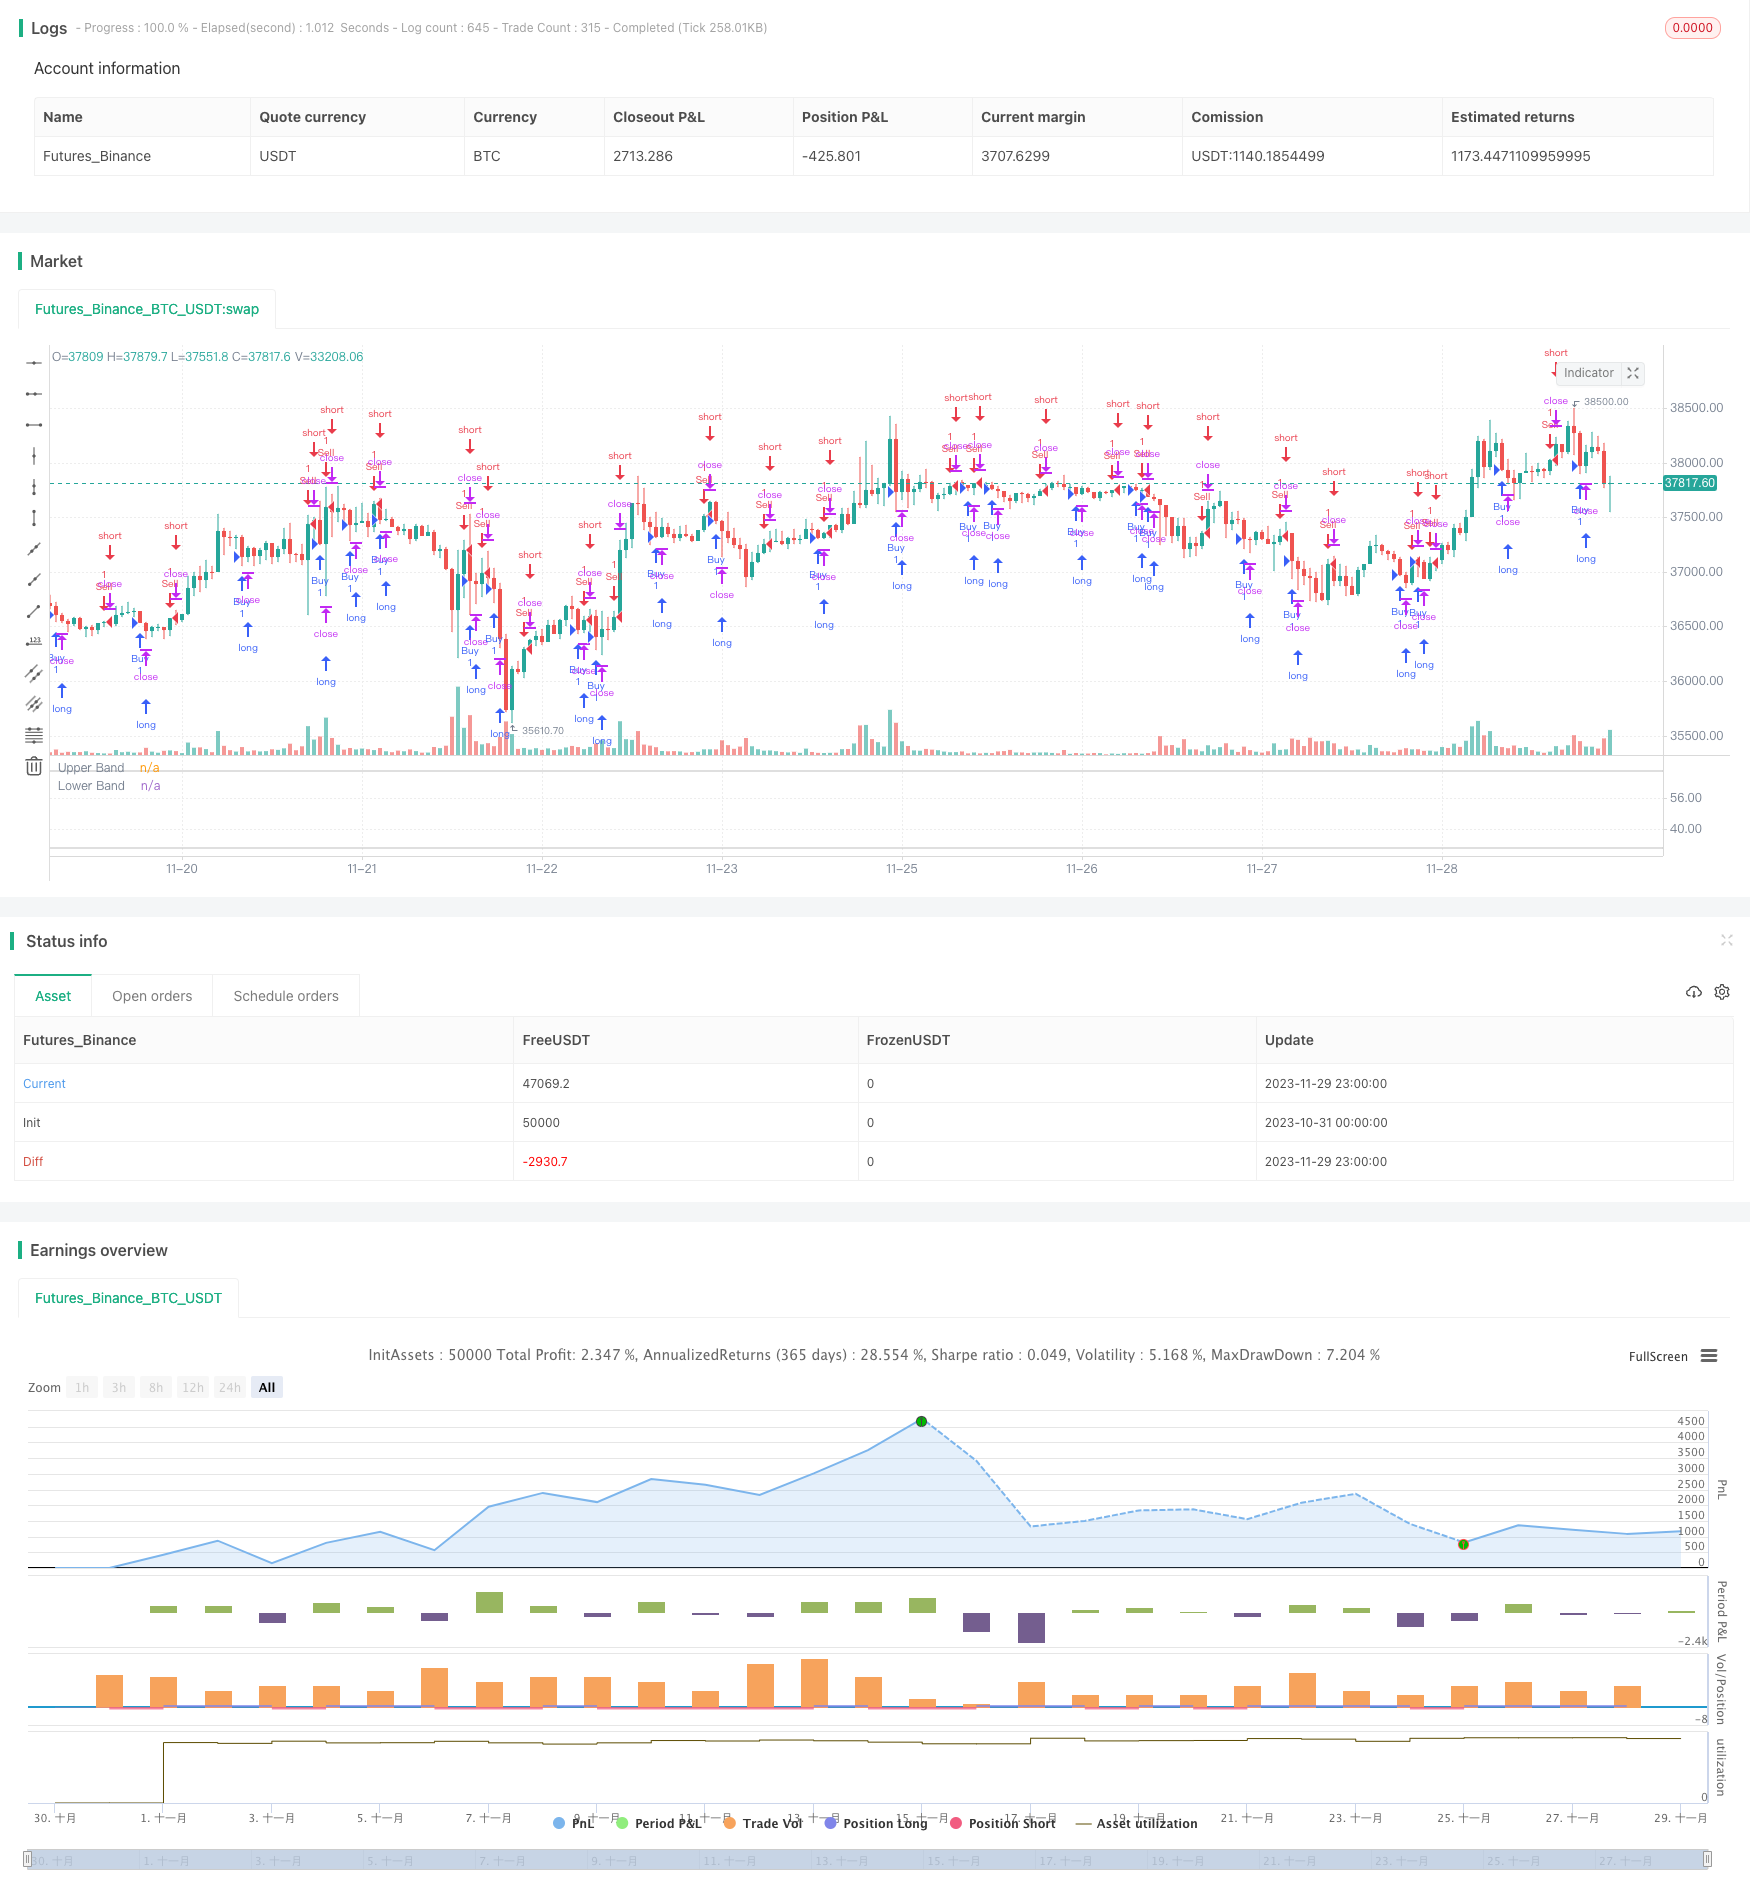
Overview
This strategy is called “Dual Moving Average Strategy”. The core idea is to generate trading signals by simultaneously using the Relative Strength Index (RSI) and Moving Average (MA) indicators. Specifically, a buy signal is generated when the RSI line crosses the MA line from top to bottom; A sell signal is generated when the RSI line crosses the MA line from bottom to top. This strategy is relatively simple, but by combining two different types of indicators, it can effectively reduce false signals and improve signal reliability.
Principle
The basic logic of the dual moving average strategy is:
- Calculate the RSI value to reflect the overbought and oversold situation of the stock
- Calculate the MA value to judge the average price trend
- When the RSI drops from the high point and enters the oversold area from the overbought area, and crosses below the MA, a buy signal is generated
- When the RSI rises from the low point, enters the overbought area from the oversold area, and crosses above the MA, a sell signal is generated.
When the above trading signals occur, we will draw relevant marks on the chart for easy visual judgment. This is the overall workflow of the dual moving average strategy.
Advantages
The biggest advantage of the dual moving average strategy is that it can effectively combine trend indicators and overbought/oversold indicators to make trading signals more reliable. Specifically, there are the following main advantages:
Reduce false signals. The combination of RSI and MA can verify signals with each other and avoid false signals generated by a single indicator.
Improve win rate. Compared with a single RSI or MA strategy, the dual moving average strategy can obtain more profitable opportunities.
Strong adaptability. This strategy uses only two parameters, simple to operate, low cost, and adapts to different market environments.
Easy to optimize. By adjusting the cycle parameters of RSI and MA, it is convenient to optimize and adapt to more varieties.
Risks
Despite the many advantages of the dual moving average strategy, risks cannot be completely avoided in actual application. The main risks include:
The MA uses historical average prices and may lag behind the latest price changes.
RSI may experience false breakouts, resulting in wrong signals.
Unable to adapt to rapidly changing trending markets, prone to stop loss.
Improper parameter settings can also greatly affect strategy performance.
In response, we mainly carry out risk control from the following aspects:
Use adaptive MA to adjust cycle parameters based on latest price changes.
Increase the stop loss mechanism to control single loss.
Optimize parameters to select the best parameter combination for testing.
Adopt step stop loss to lock in partial profits and reduce risks.
Optimization Directions
For potential issues with the dual moving average strategy, we consider optimization from the following dimensions:
Use adaptive MA instead of ordinary MA to capture price trend changes faster.
Increase volume indicator verification to avoid false breakouts. For example, only buy when the closing price and trading volume rise together.
Combine other indicators for filtering invalid signals. For example verifies of MACD or KD indicators.
Optimize parameter setting range to find the optimal parameter combination. Backtesting can find the highest profit parameter range for the strategy.
Use machine learning techniques for adaptive parameter optimization. Allow strategies to select optimal parameters based on real-time market conditions.
Through the above optimizations, it is expected to greatly improve the live performance of the dual moving average strategy.
Summary
The dual moving average strategy integrates the advantages of RSI and MA indicators. Through the cooperation of the two, more accurate and reliable trading signals can be generated. Compared with single technical indicator strategies, dual moving average strategies have higher signal accuracy, fewer false signals, easy optimization and other advantages. But the risk of misoperation cannot be completely avoided. We have also proposed some specific risk control measures. In addition, there are dimensions that can be further optimized for this strategy. By combining adaptive indicators, other auxiliary verification indicators, parameter optimization and other means, it is expected to further improve the strategy’s rate of return. In general, this strategy provides a simple and practical technical analysis solution for quantitative trading.
/*backtest
start: 2023-10-31 00:00:00
end: 2023-11-30 00:00:00
period: 1h
basePeriod: 15m
exchanges: [{"eid":"Futures_Binance","currency":"BTC_USDT"}]
*/

//@version=4
strategy(title="RSI + MA", shorttitle="RSI + MA")
reverseTrade = input(false, title = "Use Reverse Trade?")
lengthRSI = input(14, minval=1, title="RSI Length")
sourceRSI = input(close, "RSI Source", type = input.source)

showMA = input(true, title="Show MA")
lengthMA = input(9, minval=1, title="MA Length")
offsetMA = input(title="MA Offset", type=input.integer, defval=0, minval=-500, maxval=500)

up = rma(max(change(sourceRSI), 0), lengthRSI)
down = rma(-min(change(sourceRSI), 0), lengthRSI)

rsi = down == 0 ? 100 : up == 0 ? 0 : 100 - (100 / (1 + up / down))
ma = sma(rsi, lengthMA)

plot(showMA ? ma : na, "MA", color=color.blue, linewidth=2, style=0, offset=offsetMA)
plot(rsi, "RSI", color=#9915FF, linewidth=1, style=0)

band1 = hline(70, "Upper Band", color=#C0C0C0, linestyle=2, linewidth=1)
band0 = hline(30, "Lower Band", color=#C0C0C0, linestyle=2, linewidth=1)
fill(band1, band0, color=color.new(#9915FF,95), title="Background")

buy = reverseTrade ? rsi[1] < ma[1] and rsi > ma : rsi[1] > ma[1] and rsi < ma
sell = reverseTrade ? rsi[1] > ma[1] and rsi < ma : rsi[1] < ma[1] and rsi > ma

strategy.entry("Buy", true, when = buy)
strategy.entry("Sell", false, when = sell)