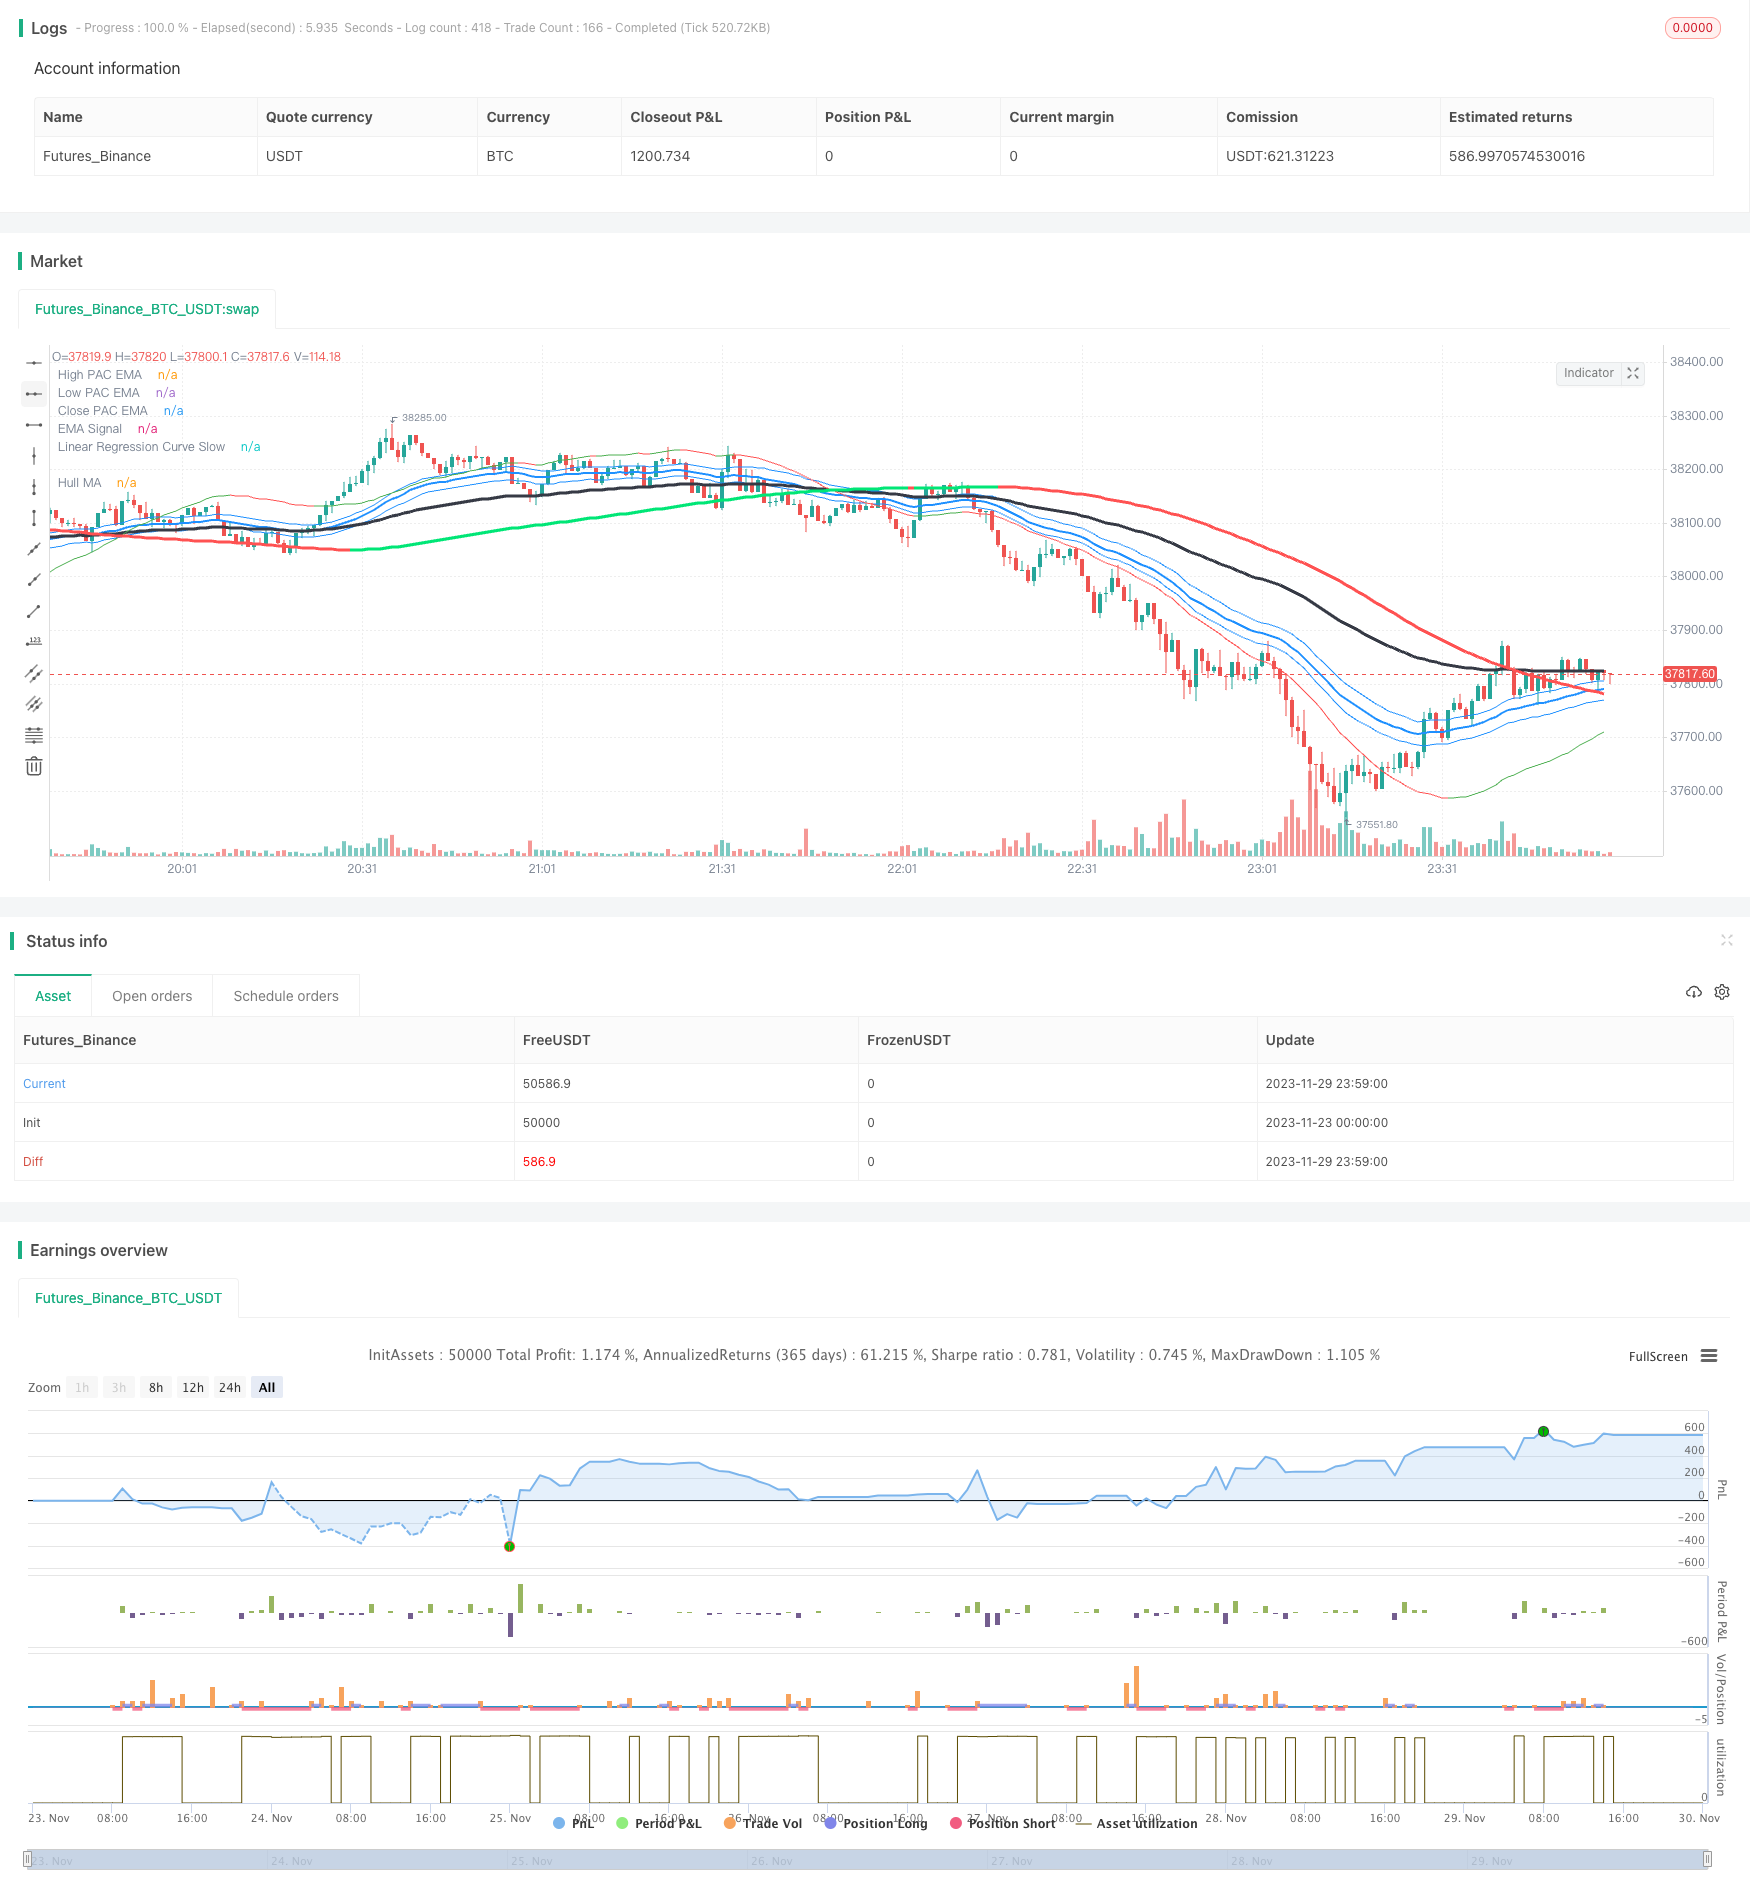
Hull MA Channel and Linear Regression Swing Trading Strategy
Author: ChaoZhang, Date: 2023-12-01 16:47:01Tags:

Overview
This is a swing trading strategy that combines Hull MA, price channel, EMA signal and linear regression. It uses Hull MA to determine market trend direction, price channel and linear regression to identify bottom area, EMA signal to time market entry, in order to capture medium-term trends.
Strategy Logic
The strategy consists of the following main indicators:
- Hull MA
- Typical period of Hull MA is 337, representing medium to long term trend direction
- When 2 times 18-period WMA is above 337-period WMA, it’s a bull market, otherwise it’s a bear market
- Price Channel
- Price channel plots EMA high and EMA low, representing support and resistance area
- EMA Signal
- Typical period is 89, representing short-term trend and entry signal
- Linear Regression
- Fast line of 6 period for bottom and breakout
- Slow line of 89 period for medium to long term trend
Entry Logic:
Long Entry: Hull MA pointing up and price above upper band, linear regression crossing up EMA signal Short Entry: Hull MA pointing down and price below lower band, linear regression crossing down EMA signal
Exit Logic:
Long Exit: Price below lower band and crossing down linear regression Short Exit: Price above upper band and crossing up linear regression
Advantage Analysis
The strategy has the following advantages:
- Higher accuracy with multiple indicators
- Hull MA for main trend, channel for support/resistance, EMA for entry
- Swing trading to capture medium-term trends
- Strategy mainly reversals to capture each medium-term cycle
- Controllable risk and smaller drawdown
- Signal only generated at high probability area, avoiding chase high kill low
Risk Analysis
There are also some risks:
- Limited optimization space
- Main parameters like EMA period is fixed, with small optimization space
- May lose in range-bound market
- Stop loss may be triggered in sideways range
- Need some technical analysis knowledge
- Strategy logic needs price action and indicator knowledge, not suitable for everyone
Improvements:
- Adjust stop loss strategy, e.g. trailing stop loss
- Optimize entry and exit logic
- Add other filter indicators like MACD
Summary
The strategy combines Hull MA, price channel, EMA and linear regression for a complete medium-term swing trading strategy. Compared to single indicator strategies, it improves accuracy significantly in catching trends and reversals. But there are still risks, requiring technical analysis knowledge. Further improvements on parameters and logic can enhance stability.
/*backtest
start: 2023-11-23 00:00:00
end: 2023-11-30 00:00:00
period: 1m
basePeriod: 1m
exchanges: [{"eid":"Futures_Binance","currency":"BTC_USDT"}]
*/

//@version=2
strategy("Swing Hull/SonicR/EMA/Linear Regression Strategy", overlay=true)
//Hull MA
n=input(title="HullMA Period",defval=377)
//
n2ma=2*wma(close,round(n/2))
nma=wma(close,n)
diff=n2ma-nma
sqn=round(sqrt(n))
//
n2ma1=2*wma(close[1],round(n/2))
nma1=wma(close[1],n)
diff1=n2ma1-nma1
sqn1=round(sqrt(n))
//
n1=wma(diff,sqn)
n2=wma(diff1,sqn)
condDown = n2 >= n1
condUp = condDown != true
col =condUp ? lime : condDown ? red : yellow
plot(n1,title="Hull MA", color=col,linewidth=3)
// SonicR + Line reg
EMA = input(defval=89, title="EMA Signal")
HiLoLen     = input(34, minval=2,title="High Low channel Length")
lr     = input(89, minval=2,title="Linear Regression Length")
pacC        = ema(close,HiLoLen)
pacL        = ema(low,HiLoLen)
pacH        = ema(high,HiLoLen)
DODGERBLUE = #1E90FFFF
// Plot the Price Action Channel (PAC) base on EMA high,low and close//
L=plot(pacL, color=DODGERBLUE, linewidth=1, title="High PAC EMA",transp=90)
H=plot(pacH, color=DODGERBLUE, linewidth=1, title="Low PAC EMA",transp=90)
C=plot(pacC, color=DODGERBLUE, linewidth=2, title="Close PAC EMA",transp=80)
//Moving Average//
signalMA =ema(close,EMA)
plot(signalMA,title="EMA Signal",color=black,linewidth=3,style=line)
linereg = linreg(close, lr, 0)
lineregf = linreg(close, HiLoLen, 0)
cline=linereg>linereg[1]?green:red
cline2= lineregf>lineregf[1]?green:red
plot(linereg, color = cline, title = "Linear Regression Curve Slow", style = line, linewidth = 1)
//plot(lineregf, color = cline2, title = "Linear Regression Curve Fast", style = line, linewidth = 1)
longCondition = n1>n2
shortCondition = longCondition != true
closeLong =  lineregf-pacH>(pacH-pacL)*2 and close<lineregf and linereg>signalMA
closeShort = pacL-lineregf>(pacH-pacL)*2 and close>lineregf and linereg<signalMA
if shortCondition
    if (close[0] < signalMA[0] and close[1] > pacL[1] and linereg>pacL and close<n1 and pacL<n1) //cross entry
        strategy.entry("SHORT", strategy.short, comment="Short")
strategy.close("SHORT", when=closeShort) //output logic
if longCondition // swing condition
    if (close[0] > signalMA[0] and close[1] < pacH[1] and linereg<pacH and close>n1 and pacH>n1) //cross entry
        strategy.entry("LONG", strategy.long, comment="Long")
strategy.close("LONG", when=closeLong) //output logic
- Momentum Dual Moving Average Trading Strategy
- Multi Take Profit and Stop Loss WaveTrend Trend Following Strategy
- Dual-directional Trading Strategy Based on RSI and STOCH RSI
- Fast and Slow EMA Golden Cross Breakthrough Strategy
- RSI and Moving Average Combination MT5 Martingale Scalping Strategy
- Volatility Stop Tracking Strategy
- Oscillation Positioning Breakthrough Strategy with Multiple Indicators
- RSI Mean Reversion Quantitative Trading Strategy Based on RSI Average Crossing
- Dual Moving Average Crossover Reversal Strategy
- Moving Average Line Reverse Crossover Strategy
- Triple SuperTrend Quantitative Trading Strategy
- Supertrend Trading Strategy Based on ATR and MA Combination
- Supertrend Bollinger Bands Strategy
- Double Reversal Tracking Strategy
- Holy Grail Strategy
- Multiple Percentage Profit Exits Strategy
- Modified Price-Volume Trend Strategy Based on Price-Volume Changes
- Dual Moving Average Crossover Strategy
- Dual Indicators Combo Crazy Intraday Scalping Strategy
- Dynamic Grid Trading Strategy