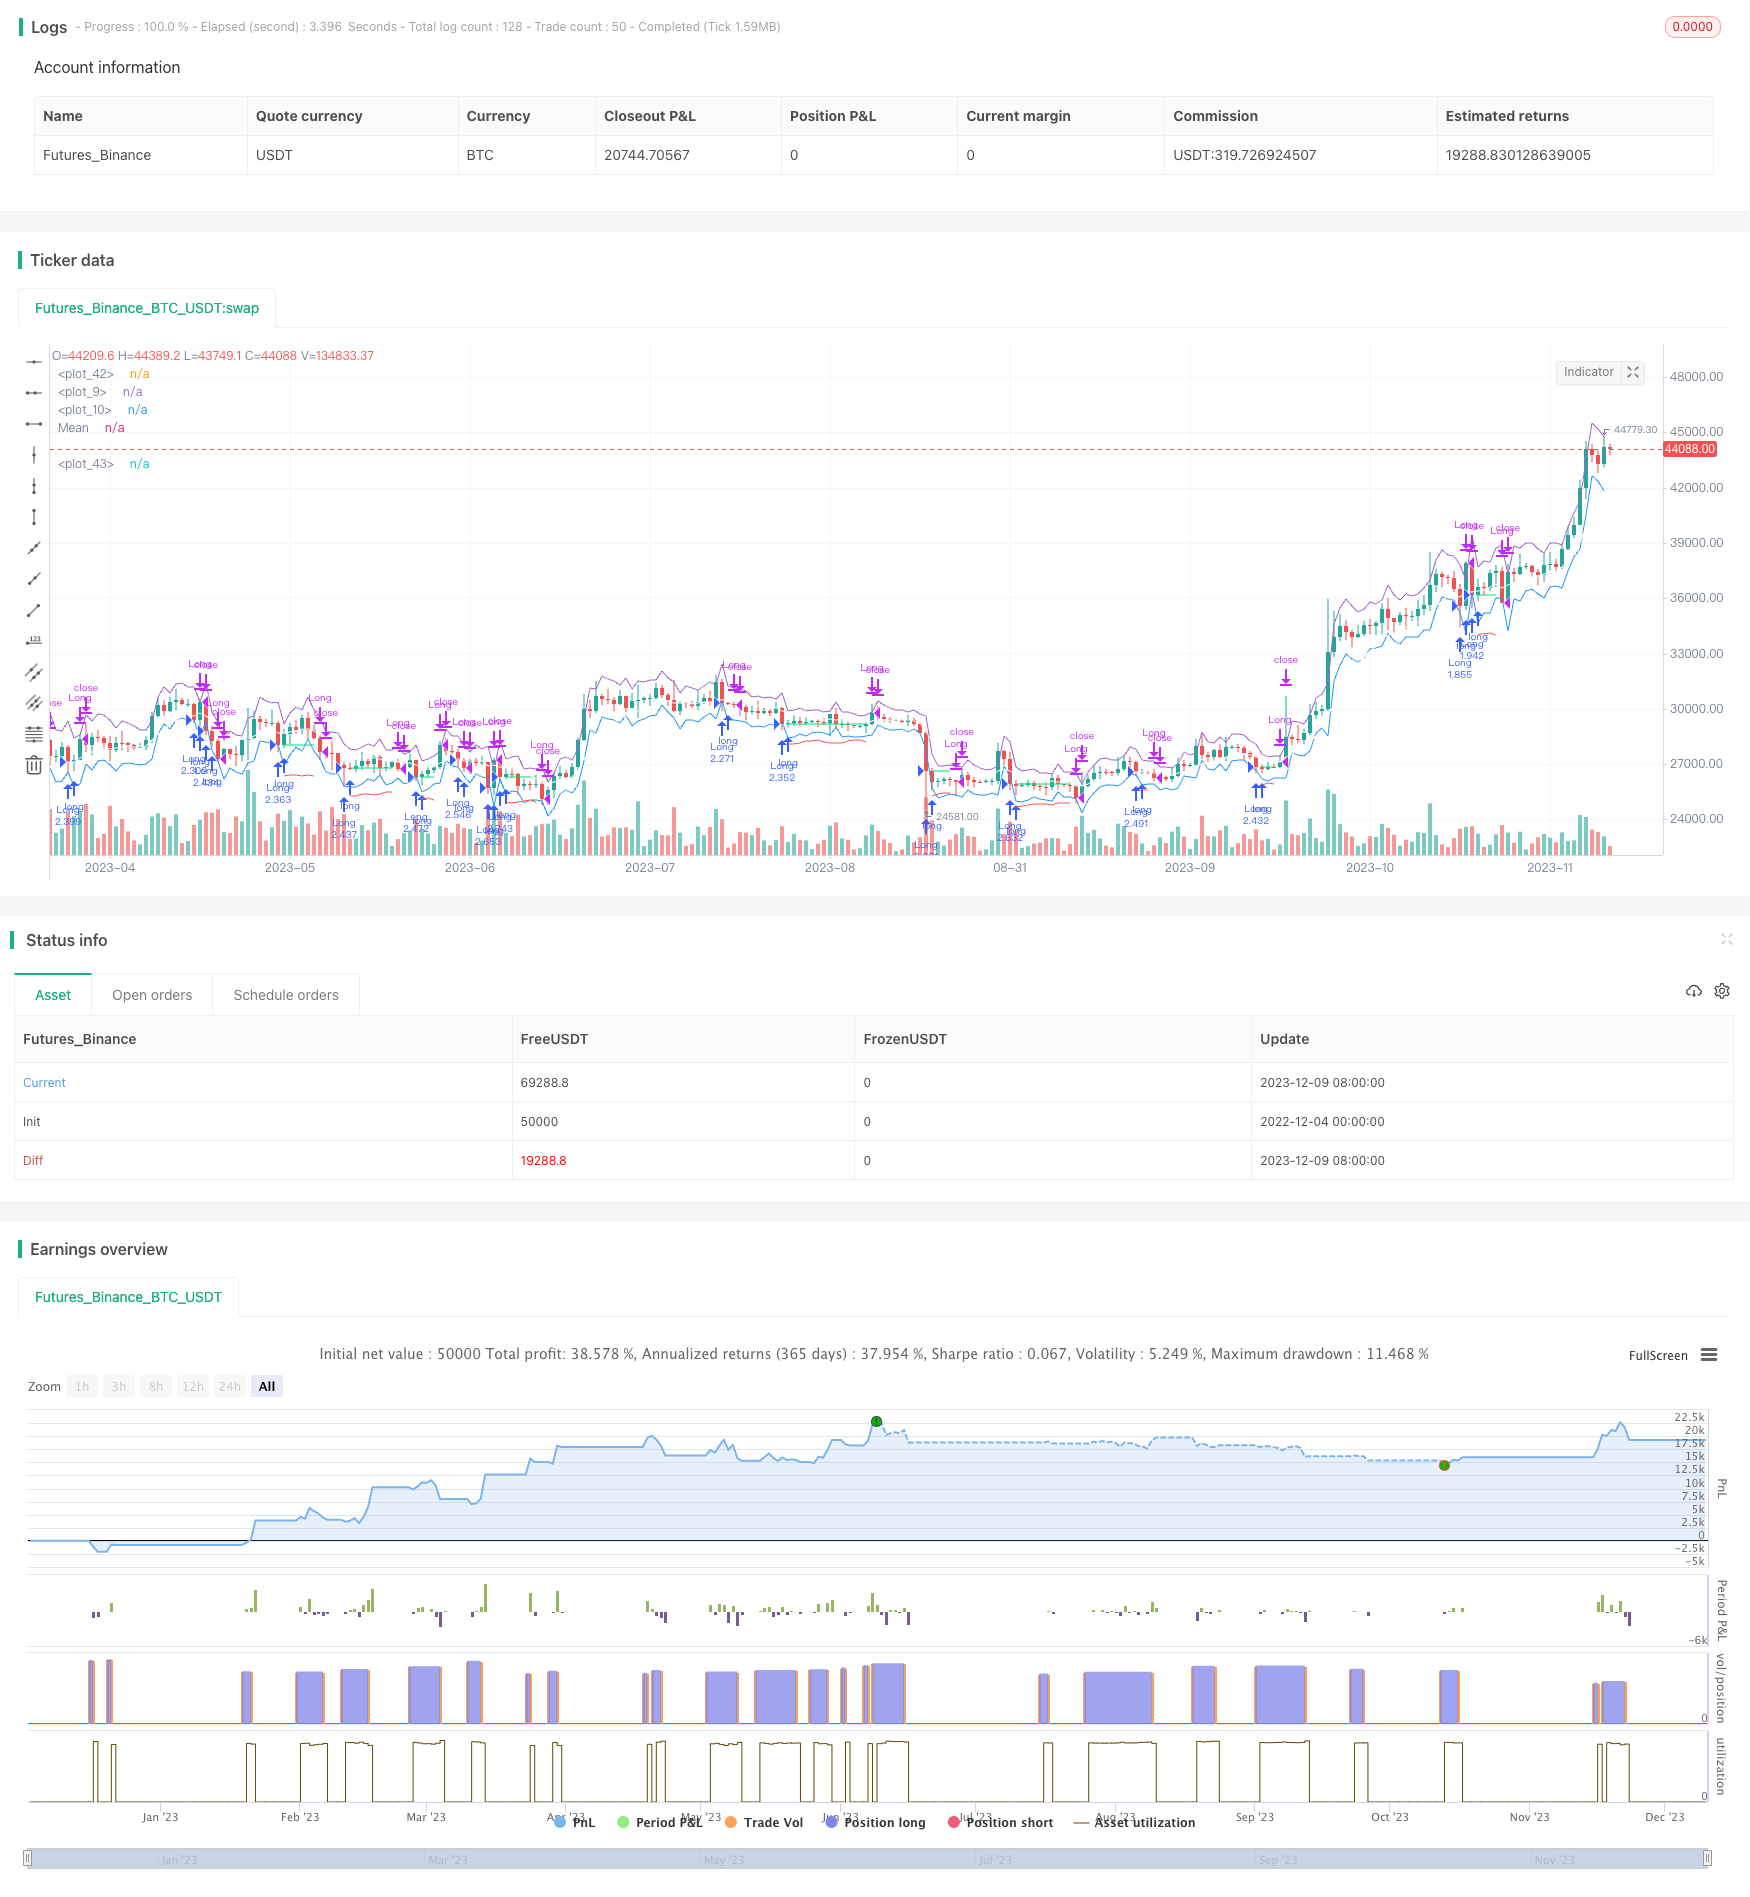
ATR Channel Mean Reversion Quantitative Trading Strategy
Author: ChaoZhang, Date: 2023-12-11 15:38:25Tags:

Overview
This is a long-only strategy that identifies entry signals when prices break below the lower band of the ATR channel, and takes profit when prices reach the middle band (EMA) or upper band of the ATR channel. It also uses ATR to calculate stop loss levels. This strategy is suitable for quick short-term trades.
Strategy Logic
When the price breaks below the lower ATR band, it signals an anomaly drop. The strategy will go long at the next candle’s open. The stop loss is set at entry price minus ATR stop loss multiplier times ATR. Take profit is at the middle band (EMA) or upper ATR band. If current bar’s close is lower than previous bar’s low, then use previous bar’s low as take profit.
Specifically, the key logic includes:
- Calculate ATR and middle band (EMA)
- Define time filters
- Identify long signal when price < lower ATR band
- Enter long at next bar’s open
- Record entry price
- Calculate stop loss price
- Take profit when price > middle band (EMA) or upper ATR band
- Stop out when price < stop loss price
Advantage Analysis
The advantages of this strategy:
- Uses ATR channel for reliable entry and exit signals
- Only long after anomaly drop avoids chasing highs
- Strict stop loss controls risk
- Suitable for quick short-term trades
- Simple logic easy to implement and optimize
Risk Analysis
There are some risks:
- High trading frequency leads to higher transaction costs and slippage
- Consecutive stop loss triggers may happen
- Inappropriate parameter optimization impacts performance
- Large price swings may result in oversized stop loss
These risks can be reduced by adjusting ATR period, stop loss multiplier etc. Choosing brokers with low trading fees is also important.
Optimization Directions
The strategy can be improved by:
- Adding other filter indicators to avoid missing best entry signals
- Optimizing ATR period
- Considering re-entry mechanism
- Adaptive stop loss size
- Adding trend filter to avoid counter-trend trades
Conclusion
In summary, this is a simple and practical mean reversion strategy based on ATR channel. It has clear entry rules, strict stop loss, and reasonable take profit. There is also room for parameter tuning. If traders can choose the right symbol and control risk with stop loss, this strategy can achieve good results.
/*backtest
start: 2022-12-04 00:00:00
end: 2023-12-10 00:00:00
period: 1d
basePeriod: 1h
exchanges: [{"eid":"Futures_Binance","currency":"BTC_USDT"}]
*/

// This source code is subject to the terms of the Mozilla Public License 2.0 at https://mozilla.org/MPL/2.0/
// © Bcullen175

//@version=5
strategy("ATR Mean Reversion", overlay=true, initial_capital=100000,default_qty_type=strategy.percent_of_equity, default_qty_value=100, commission_type=strategy.commission.percent, commission_value=6E-5) // Brokers rate (ICmarkets = 6E-5)
SLx = input(1.5, "SL Multiplier", tooltip = "Multiplies ATR to widen stop on volatile assests, Higher values reduce risk:reward but increase winrate, Values below 1.2 are not reccomended")
src = input(close, title="Source")
period = input.int(10, "ATR & MA PERIOD")
plot(open+ta.atr(period))
plot(open-ta.atr(period))
plot((ta.ema(src, period)), title = "Mean", color=color.white)

i_startTime     = input(title="Start Filter", defval=timestamp("01 Jan 1995 13:30 +0000"), group="Time Filter", tooltip="Start date & time to begin searching for setups")
i_endTime       = input(title="End Filter", defval=timestamp("1 Jan 2099 19:30 +0000"), group="Time Filter", tooltip="End date & time to stop searching for setups")

// Check filter(s)
f_dateFilter = true

atr = ta.atr(period)

// Check buy/sell conditions
var float buyPrice = 0
buyCondition    = low < (open-ta.atr(period)) and strategy.position_size == 0 and f_dateFilter
sellCondition   = (high > (ta.ema(close, period)) and strategy.position_size > 0 and close < low[1]) or high > (open+ta.atr(period))
stopDistance    = strategy.position_size > 0 ? ((buyPrice - atr)/buyPrice) : na
stopPrice       = strategy.position_size > 0 ? (buyPrice - SLx*atr): na
stopCondition   = strategy.position_size > 0 and low < stopPrice

// Enter positions
if buyCondition
    strategy.entry(id="Long", direction=strategy.long)

if buyCondition[1]
    buyPrice := open

// Exit positions
if sellCondition or stopCondition
    strategy.close(id="Long", comment="Exit" + (stopCondition ? "SL=true" : ""))
    buyPrice := na

// Draw pretty colors
plot(buyPrice, color=color.lime, style=plot.style_linebr)
plot(stopPrice, color=color.red, style=plot.style_linebr, offset=-1)
- Mean Reversion Trend Following Strategy Based on HA Momentum Breakout
- Momentum Tracking Adaptive Statistical Arbitrage Strategy
- Derivative Based Trend Strategy
- Four-factor Momentum Tracking Trading Strategy Based on ADX, BB %B, AO and EMA
- RSI-MA Trend Following Strategy
- ADX、RSI Momentum Indicators Strategy
- EMA Strategy with ATR Stop Loss
- Look-Up and Look-Down Strategy Based on Internal Price Channels
- EMA and SuperTrend Combined Trend Following Strategy
- Dynamic Trend Following Strategy
- Double Moving Average Crossover Strategy
- Inside Bar Range Breakout Strategy
- Dual Moving Average Bollinger Band Trend Tracking Strategy
- Moving Average Trend Following Trading Strategy
- Ichimoku Trend Following Strategy
- MACD Trend Following Strategy
- Octa-EMA and Ichimoku Cloud Quantitative Trading Strategy
- The Smooth Moving Average Ribbon Strategy
- 52 Week High Low Box Trading Strategy
- Oscillation Trading Strategy Between Moving Averages