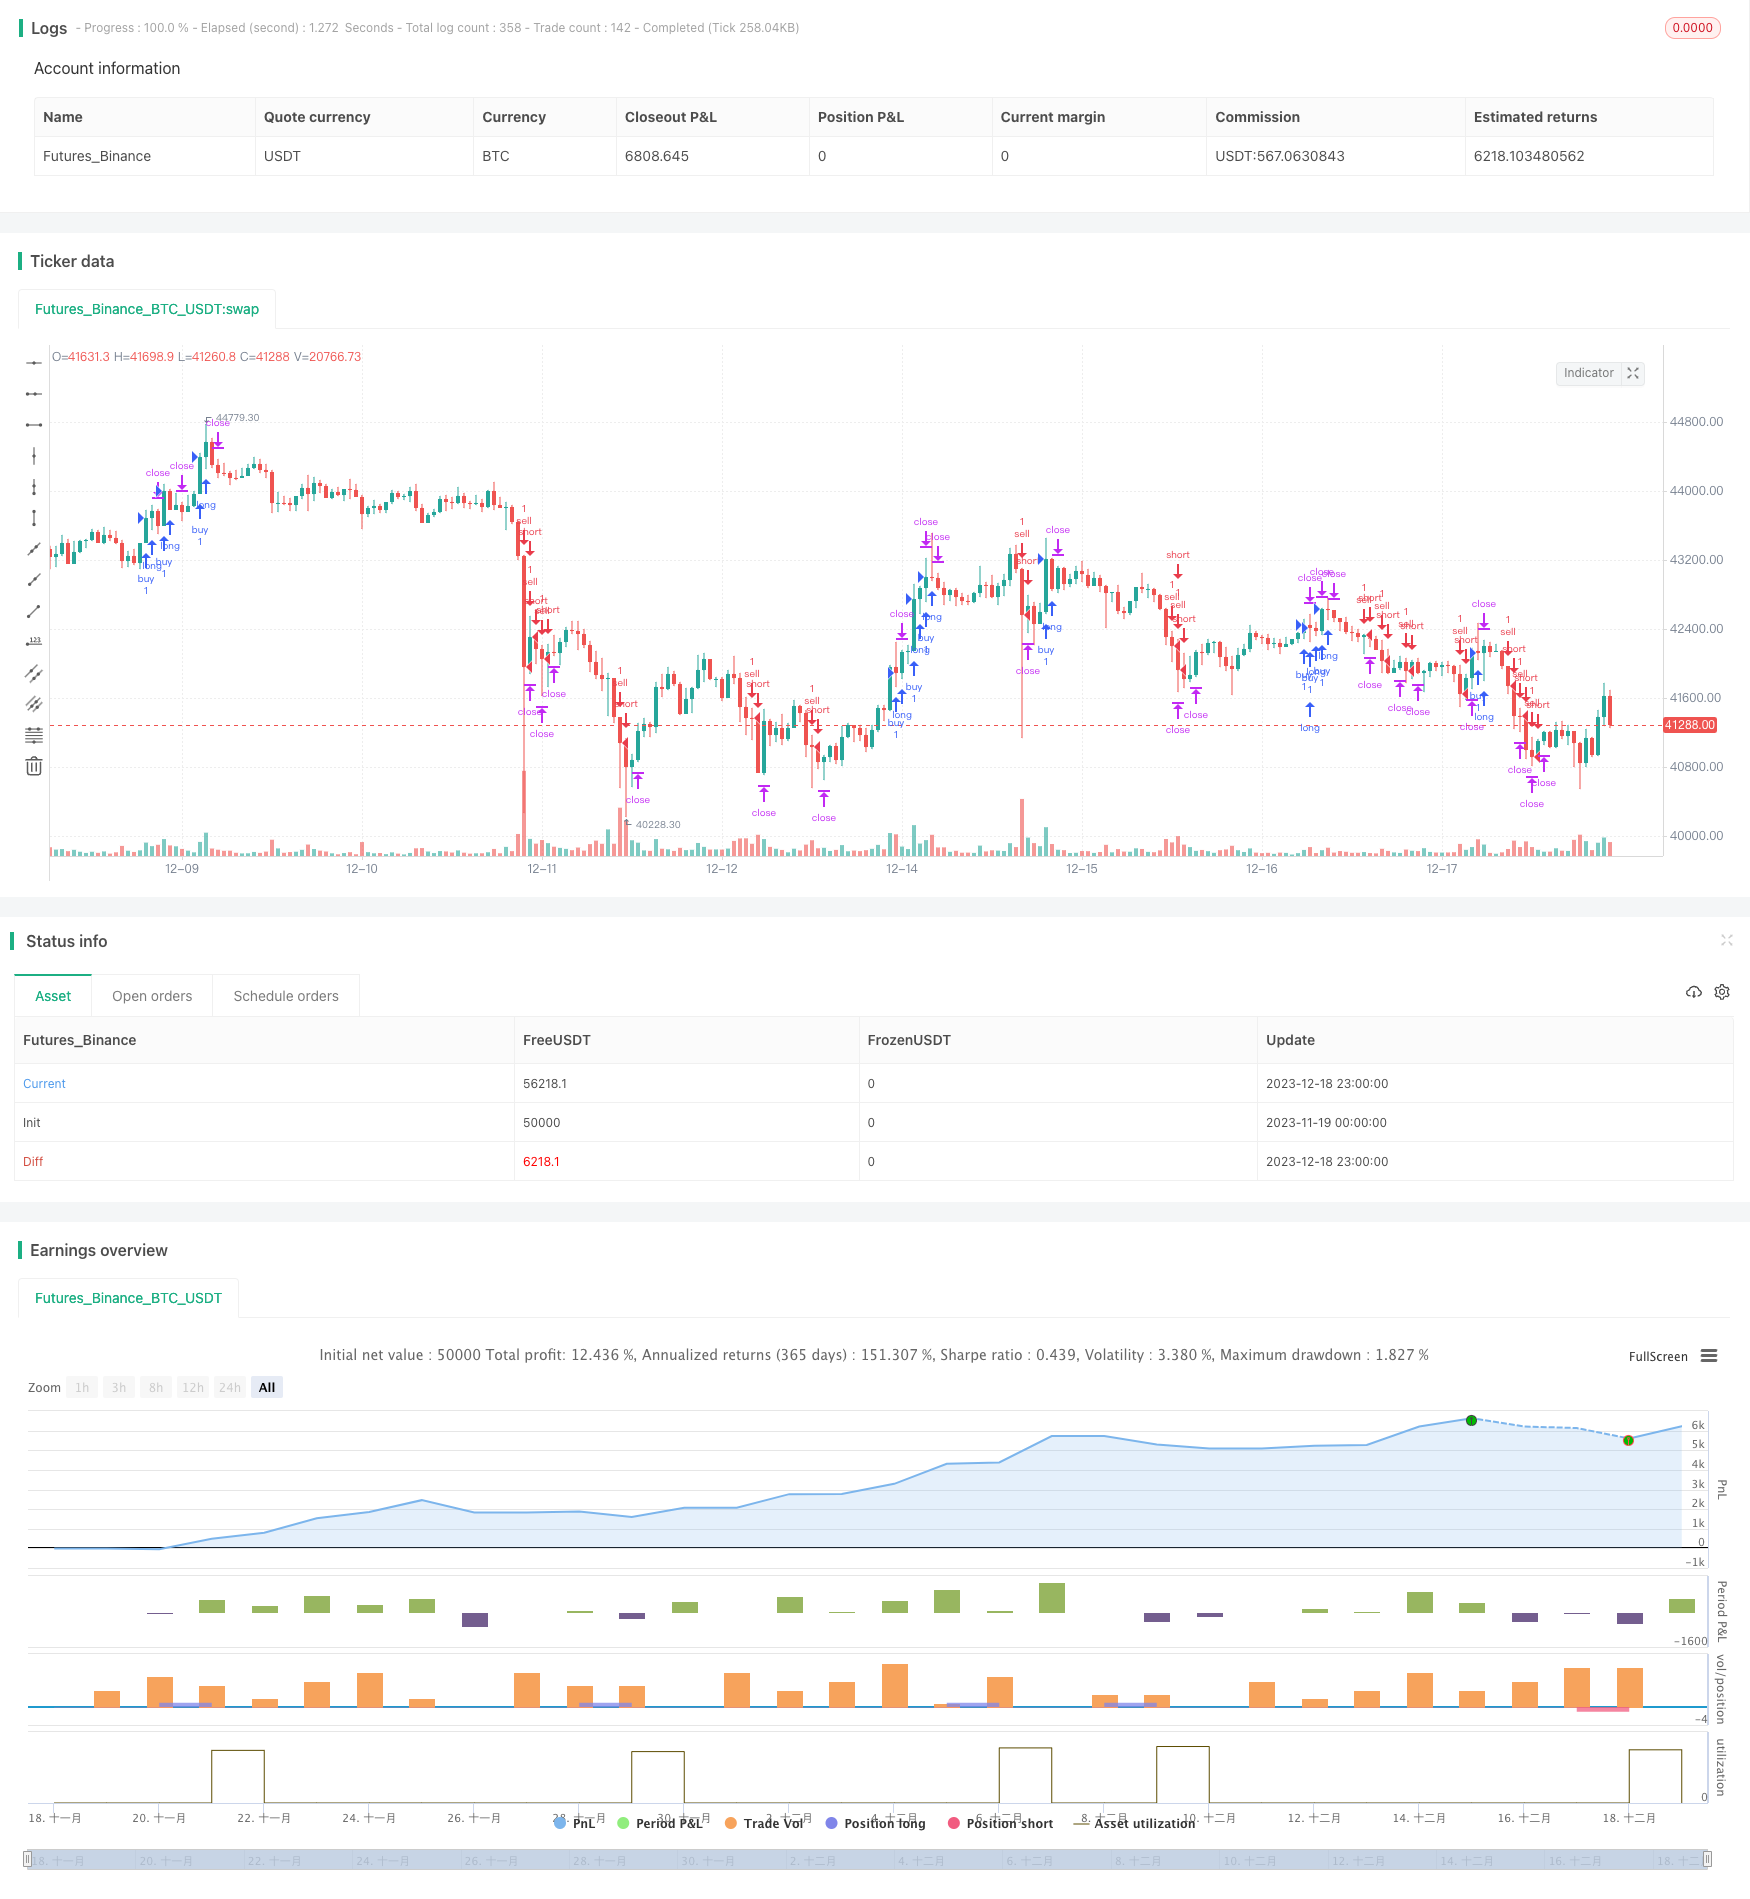
Bollinger Bands and RSI Trend Following Strategy
Author: ChaoZhang, Date: 2023-12-20 14:32:40Tags:

Overview
This strategy utilizes Bollinger Bands, RSI indicator and 200-period moving average to identify trend direction and enter counter-trend trades near the Bollinger Bands when the trend direction is appropriate, in order to make profits.
Strategy Logic
Firstly, the 200-period moving average is used to determine the overall trend direction. An uptrend is defined when the price is above the moving average, and a downtrend is defined when the price is below. Secondly, when in an uptrend, a long entry is executed if the RSI indicator shows oversold and gets close to the Bollinger Lower Band; when in a downtrend, a short entry is executed if the RSI shows overbought and gets close to the Bollinger Upper Band. Finally, the ATR indicator is used to set stop loss level, and the take profit is set to be 2 times of the stop loss.
Advantage Analysis
The biggest advantage of this strategy is that it combines multiple indicators to determine trend direction and timing of entries. Firstly, the 200-day moving average can effectively identify the major trend. Secondly, the Upper/Lower Bands of Bollinger Bands indicate areas where prices may reverse. Finally, the RSI suggests possible reversal timing. The use of multiple indicators avoids the risk of misjudgment from a single one.
Risk Analysis
The main risks of this strategy come from inaccurate identification of major trends and reversal signals. If the trend is misjudged, it may lead to consecutive losses. If reversal signals are wrong, the chance of stop loss being triggered would be high. Also, counter-trend trading itself has higher risks that require cautious operation.
To mitigate the above risks, it is advisable to adjust the parameters of the moving average or add other indicators for confirmation, in order to improve accuracy. Also the stop loss level can be loosened to prevent it being triggered too easily.
Optimization Directions
There is large room for optimizing this strategy: first, adjust the parameters of the moving average to improve accuracy of trend identification. Second, tune parameters of Bollinger Bands or add Kalman Channels to better locate reversal zones. Third, add other indicators like MACD for confirmation to avoid wrong signals. Fourth, optimize the stop loss ratio setting to lower the chance of actual stop loss events.
Conclusion
This strategy combines Bollinger Bands, RSI and Moving Averages to determine trends and timing, and has achieved good results. But further optimization on parameter tuning and risk control is needed to improve profit stability. Overall, with clear logic and easy implementation, it is worth further research and application.
/*backtest
start: 2023-11-19 00:00:00
end: 2023-12-19 00:00:00
period: 1h
basePeriod: 15m
exchanges: [{"eid":"Futures_Binance","currency":"BTC_USDT"}]
*/

//@version=4
strategy("Gab EMA + rsi + bb", overlay=true)
// Custom RSI
RSIlength = input(3, minval=1 , title="lookback length of RSI")
RSIOverBought = input(70, title="RSI OB")
RSIOverSold = input(30, title="RSI OS")
RSIprice = close
vrsi = rsi(RSIprice, RSIlength)


//Bollinger Bands
BBlength = input(20, minval=1,title="Bollinger Period Length")
BBmult = input(2.0, minval=0.001, maxval=50, title="Bollinger Bands Standard Deviation")
BBbasis = sma(close, BBlength)
BBdev = BBmult * stdev(close, BBlength)
BBupper = BBbasis + BBdev
BBlower = BBbasis - BBdev
source = close

//EMA
emaLength=input(200)

//Set TP and SL values
sl_short = high + (syminfo.mintick * 5 * 10)
tp_short = low - (syminfo.mintick * 10 * 10)
sl_long = low - (syminfo.mintick * 5 * 10)
tp_long = high + (syminfo.mintick * 10 * 10)


//Strategy Entry and Exit
strategy.entry("sell", strategy.short, when = low < ema(low, emaLength) and vrsi < RSIOverSold and low < BBlower and barstate.isconfirmed)
strategy.exit("closeshort", from_entry="sell", limit=tp_short, stop=sl_short, when=strategy.position_size != 0)

strategy.entry("buy", strategy.long, when = high > ema(high, emaLength) and vrsi > RSIOverBought and high > BBupper and barstate.isconfirmed)
strategy.exit("closelong", from_entry="buy", limit=tp_long, stop=sl_long, when=strategy.position_size != 0)
- Quantitative Trading Strategy Based on Bollinger Bands and RSI
- The Relative Volume Indicator Strategy
- The Octagon Cloud Tracing Strategy
- Probability-Enhanced RSI Strategy
- Triple EMA Trend Following Strategy
- Stan The Man - An Advanced Stock Trading Strategy Based on Dual Moving Average and Volatility
- Reverse Mean Breakthrough Strategy
- Double Moving Average Reversal Strategy
- Logarithmic Price Forecasting Strategy
- Simple Moving Average Crossover Strategy
- Meticulous EMA Crossover Strategy
- Trend Following Strategy Based on Moving Average
- RSI Trading Strategy
- Turtle Trend Trading System
- Multiple Moving Averages Crossover Trading Strategy
- Flexible MA/VWAP Crossover Strategy with Stop Loss/Take Profit
- Bollinger Band-based Price Action Strategy
- Dual Moving Average Range Breakout Strategy
- Grid Strategy with Moving Average Lines
- Dual Moving Average Intelligent Tracking Strategy