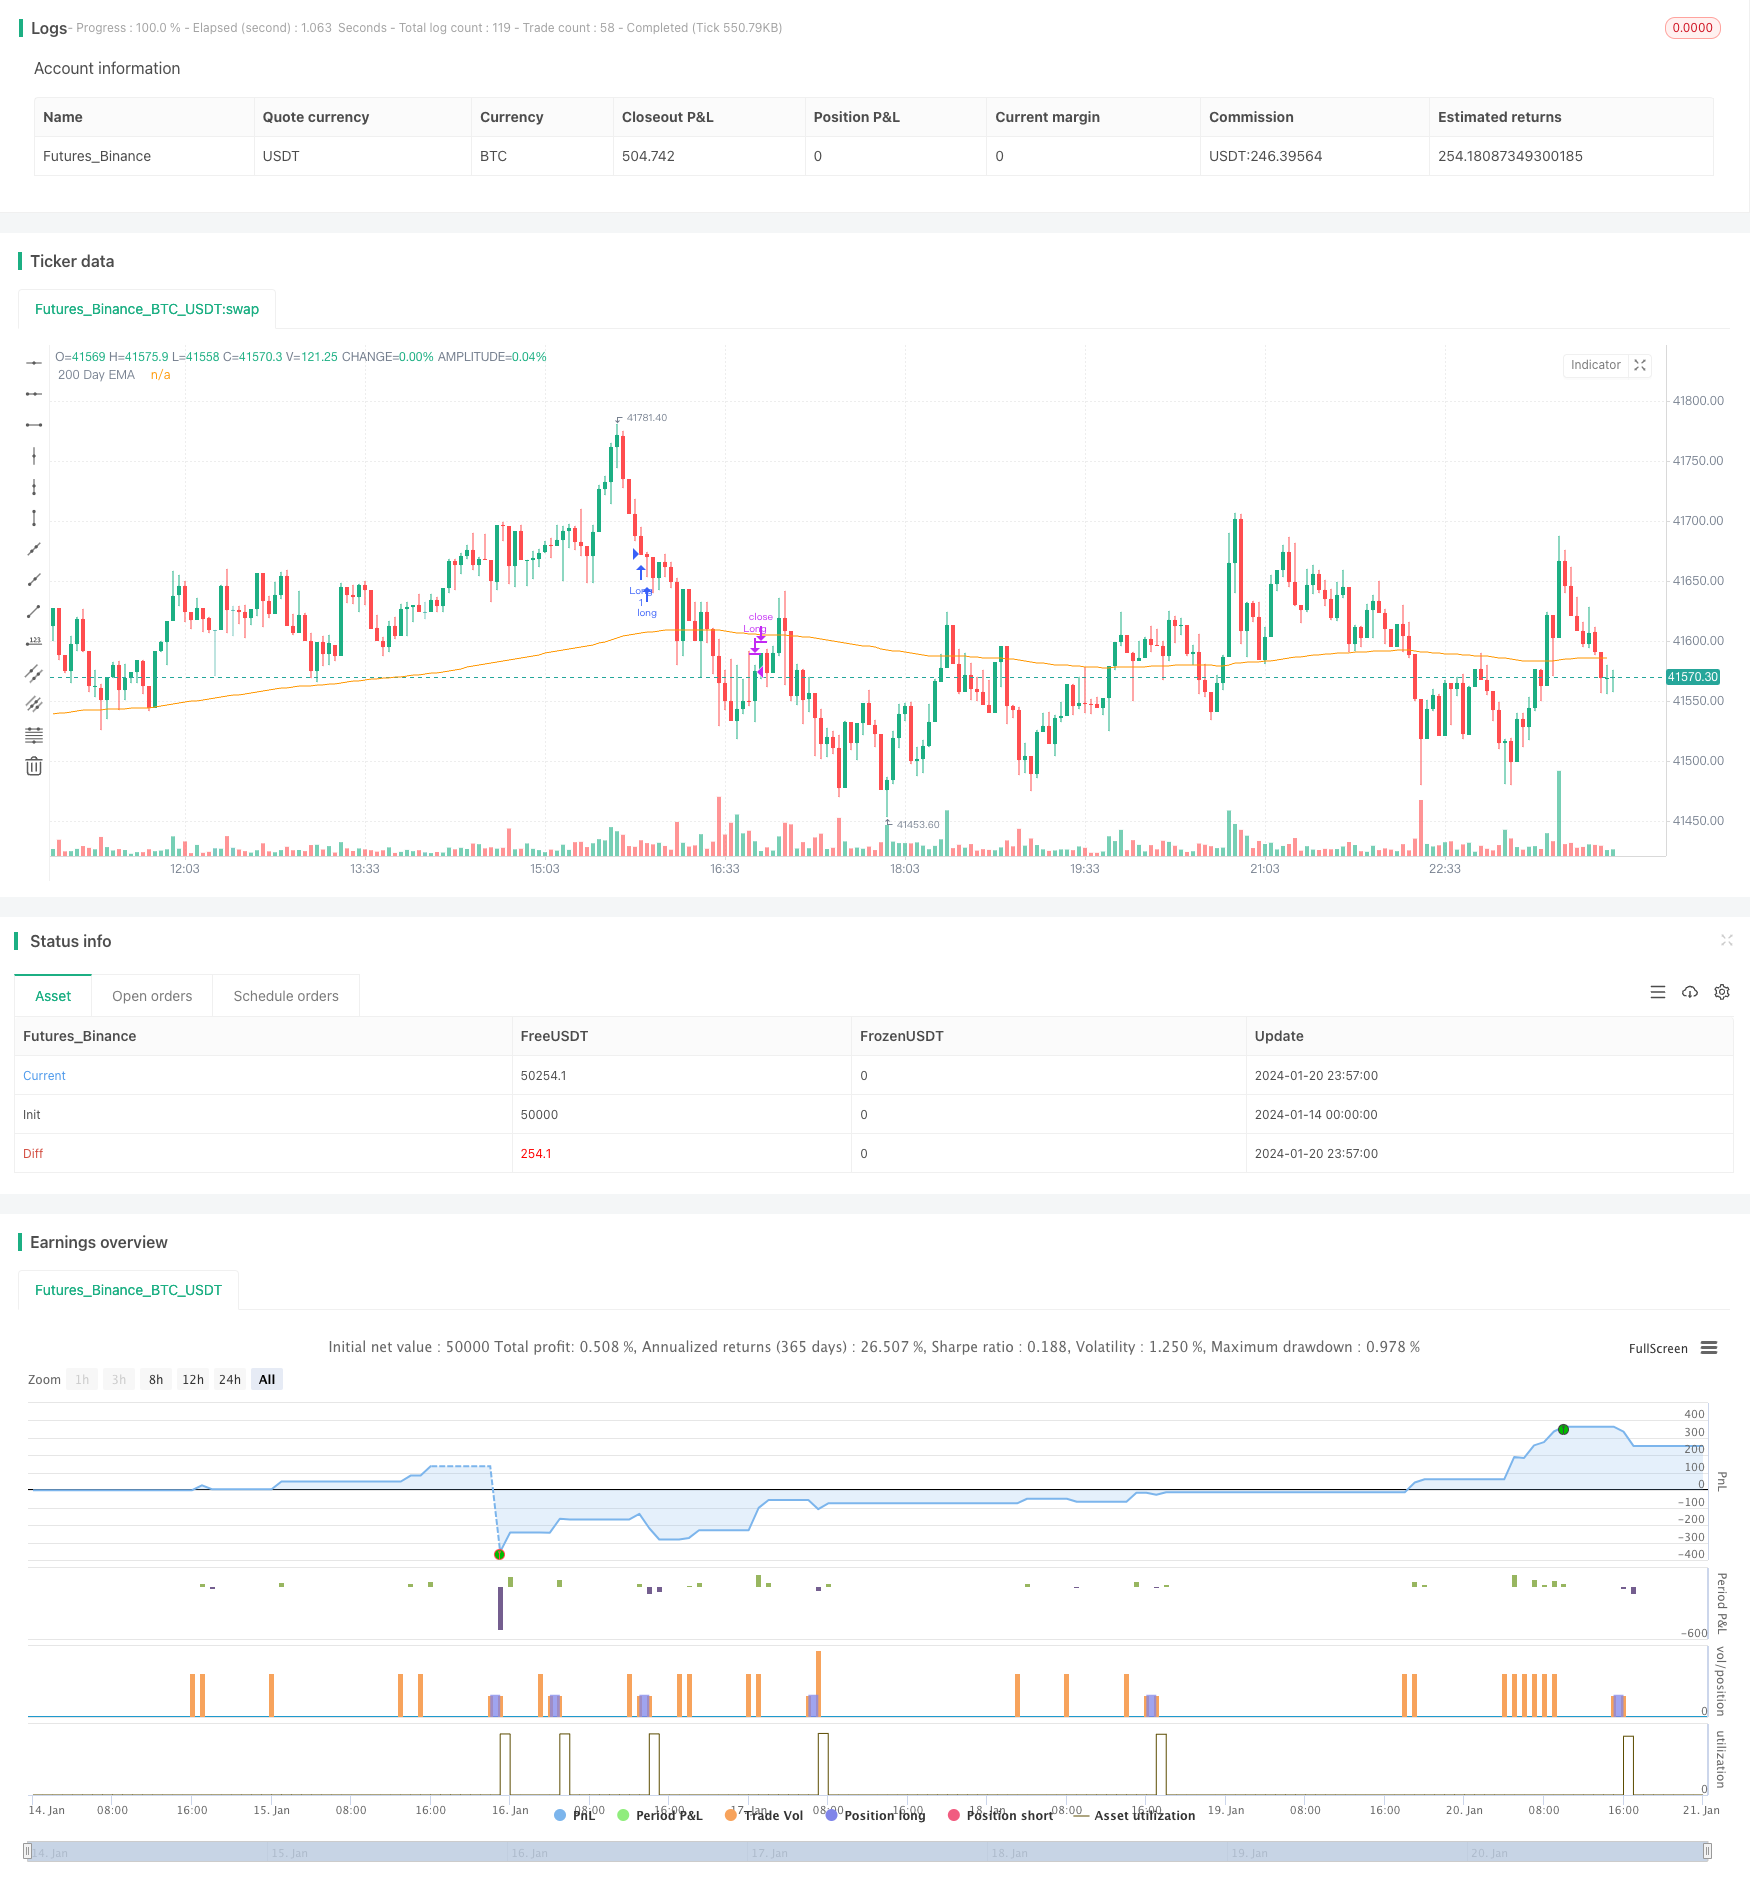
Reversal RSI Trend Tracking ETF Trading Strategy
Author: ChaoZhang, Date: 2024-01-22 17:15:18Tags:

Overview
This strategy is a reversal trend tracking ETF trading strategy based on the Relative Strength Index (RSI). It judges the short-term overbought and oversold conditions through the RSI indicator to make reversal entries and exits. Meanwhile, it uses the 200-day moving average to determine the overall trend direction.
Strategy Principle
The core logic of this strategy is based on the reversal principle of the RSI indicator. The RSI indicator calculates the average amplitude of rises and falls over a period of time to judge whether the trading variety is in an overbought or oversold state. An RSI above 70 represents overbought conditions, while an RSI below 30 represents oversold conditions. At this point, a reversal trend may occur.
This strategy utilizes this principle by setting the buy trigger when today’s RSI is below the adjustable parameter TodaysMinRSI, and the RSI 3 days ago is below the adjustable parameter Day3RSIMax. This indicates the price may be in a short-term oversold region and a bounce is likely. It also requires a downward RSI trend in the last 3 days, i.e. continuous RSI decline before buying to avoid false breakouts.
The exit mechanism of the strategy is when the RSI indicator once again exceeds the threshold value of the adjustable parameter Exit RSI, it is considered that the rebound has ended and positions should be closed there.
The strategy also introduces the 200-day moving average to judge the overall trend direction. Only when the price is above the 200-day line, long entry orders can be made. This helps ensure only buying in uptrend phases and avoids the risks of countertrend trading.
Advantage Analysis
- Utilize RSI indicator to determine overbought and oversold zones where rebounds are likely.
- Incorporate 200-day line to determine major trend direction, which helps avoid countertrend trading.
- The RSI reversal trading principle is classic and reliable with high success rate.
- Adjustable parameters provide flexibility that can be optimized for different varieties.
Risks and Solutions
- RSI indicator has the possibility of false breakouts, unable to completely avoid losing trades. Stop loss can be set to control single trade loss.
- Failed reversals may lead to enlarged losses. Holding period can be shortened with timely stop loss.
- Improper parameter settings may lead to over-aggressiveness or over-conservativeness, missing trade opportunities. Parameters must be optimized for each variety through backtesting.
Optimization Directions
- Incorporate other indicators like KDJ, Bollinger Bands etc to form indicator combinations, improving signal accuracy.
- Add moving stop loss strategies to make the stop loss level dynamic, reducing losses.
- Add position sizing or money management modules to control risk exposure per trade.
- Optimize parameters and backtest for different varieties to come up with parameter sets fitting each variety.
Summary
This strategy utilizes the classic RSI entry and exit points by judging overbought and oversold zones for reversal trades. Meanwhile, considering major trend and parameter optimization, it is a highly reliable short-term reversal ETF strategy. With further optimizations, it can become a quant strategy with practical effects.
/*backtest
start: 2024-01-14 00:00:00
end: 2024-01-21 00:00:00
period: 3m
basePeriod: 1m
exchanges: [{"eid":"Futures_Binance","currency":"BTC_USDT"}]
*/

// This source code is subject to the terms of the Mozilla Public License 2.0 at https://mozilla.org/MPL/2.0/
// @version = 5
// Author = TradeAutomation


strategy(title="R3 ETF Strategy", shorttitle="R3 ETF Strategy", overlay=true)


// Backtest Date Range Inputs //
StartTime = input(defval=timestamp('01 Jan 2012 05:00 +0000'), title='Start Time')
EndTime = input(defval=timestamp('01 Jan 2099 00:00 +0000'), title='End Time')
InDateRange = true

// Calculations and Inputs //
RSILen = input.int(2, "RSI Length")
RSI = ta.rsi(close, RSILen)
TodaysMinRSI = input.int(10, "Today's Min RSI for Entry", tooltip = "The RSI must be below this number today to qualify for trade entry")
Day3RSIMax = input.int(60, "Max RSI 3 Days Ago for Entry", tooltip = "The RSI must be below this number 3 days ago to qualify for trade entry")
EMA = ta.ema(close, 200)

// Strategy Rules //
Rule1 = close>ta.ema(close, 200)
Rule2 = RSI[3]<Day3RSIMax and RSI<TodaysMinRSI
Rule3 = RSI<RSI[1] and RSI[1]<RSI[2] and RSI[2]<RSI[3]
Exit = ta.crossover(RSI, input.int(70, "Exit RSI", tooltip = "The strategy will sell when the RSI crosses over this number"))

// Plot //
plot(EMA, "200 Day EMA")

// Entry & Exit Functions //
if (InDateRange)
    strategy.entry("Long", strategy.long, when = Rule1 and Rule2 and Rule3)
//    strategy.close("Long", when = ta.crossunder(close, ATRTrailingStop))
    strategy.close("Long", when = Exit)
if (not InDateRange)
    strategy.close_all()
- Quant Trading Strategy Based on Moving Average Crossover
- Multi Timeframe Trend Following Strategy
- Dynamic Grid Trading Strategy
- A Dual Moving Average Confirmation Advantage Line Strategy
- Crypto RSI Mini-Sniper Quick Response Trend Following Strategy
- This strategy is a momentum strategy based on moving average lines
- Supply Demand Momentum Reversal Trading Strategy
- Dynamic Momentum Oscillator Trading Strategy
- Trend Following Strategy Based on Moving Average
- Trend Tracking Breakout Strategy
- Trend Tracking and Short-term Trading Strategy Based on ADX Indicator
- Momentum Trend Dual Strategy
- Dynamic CCI Support and Resistance Strategy
- QQE Momentum Trading Strategy
- The Gauss Wave Forecasting Strategy
- Dynamic Moving EMAs Combination Quant Strategy
- Donchian Channel Trend Following Strategy
- EMA Ribbon Strategy
- Precise Trend Reversal Moving Average Crossover Strategy
- Multi-EMA Bullish Trend Strategy