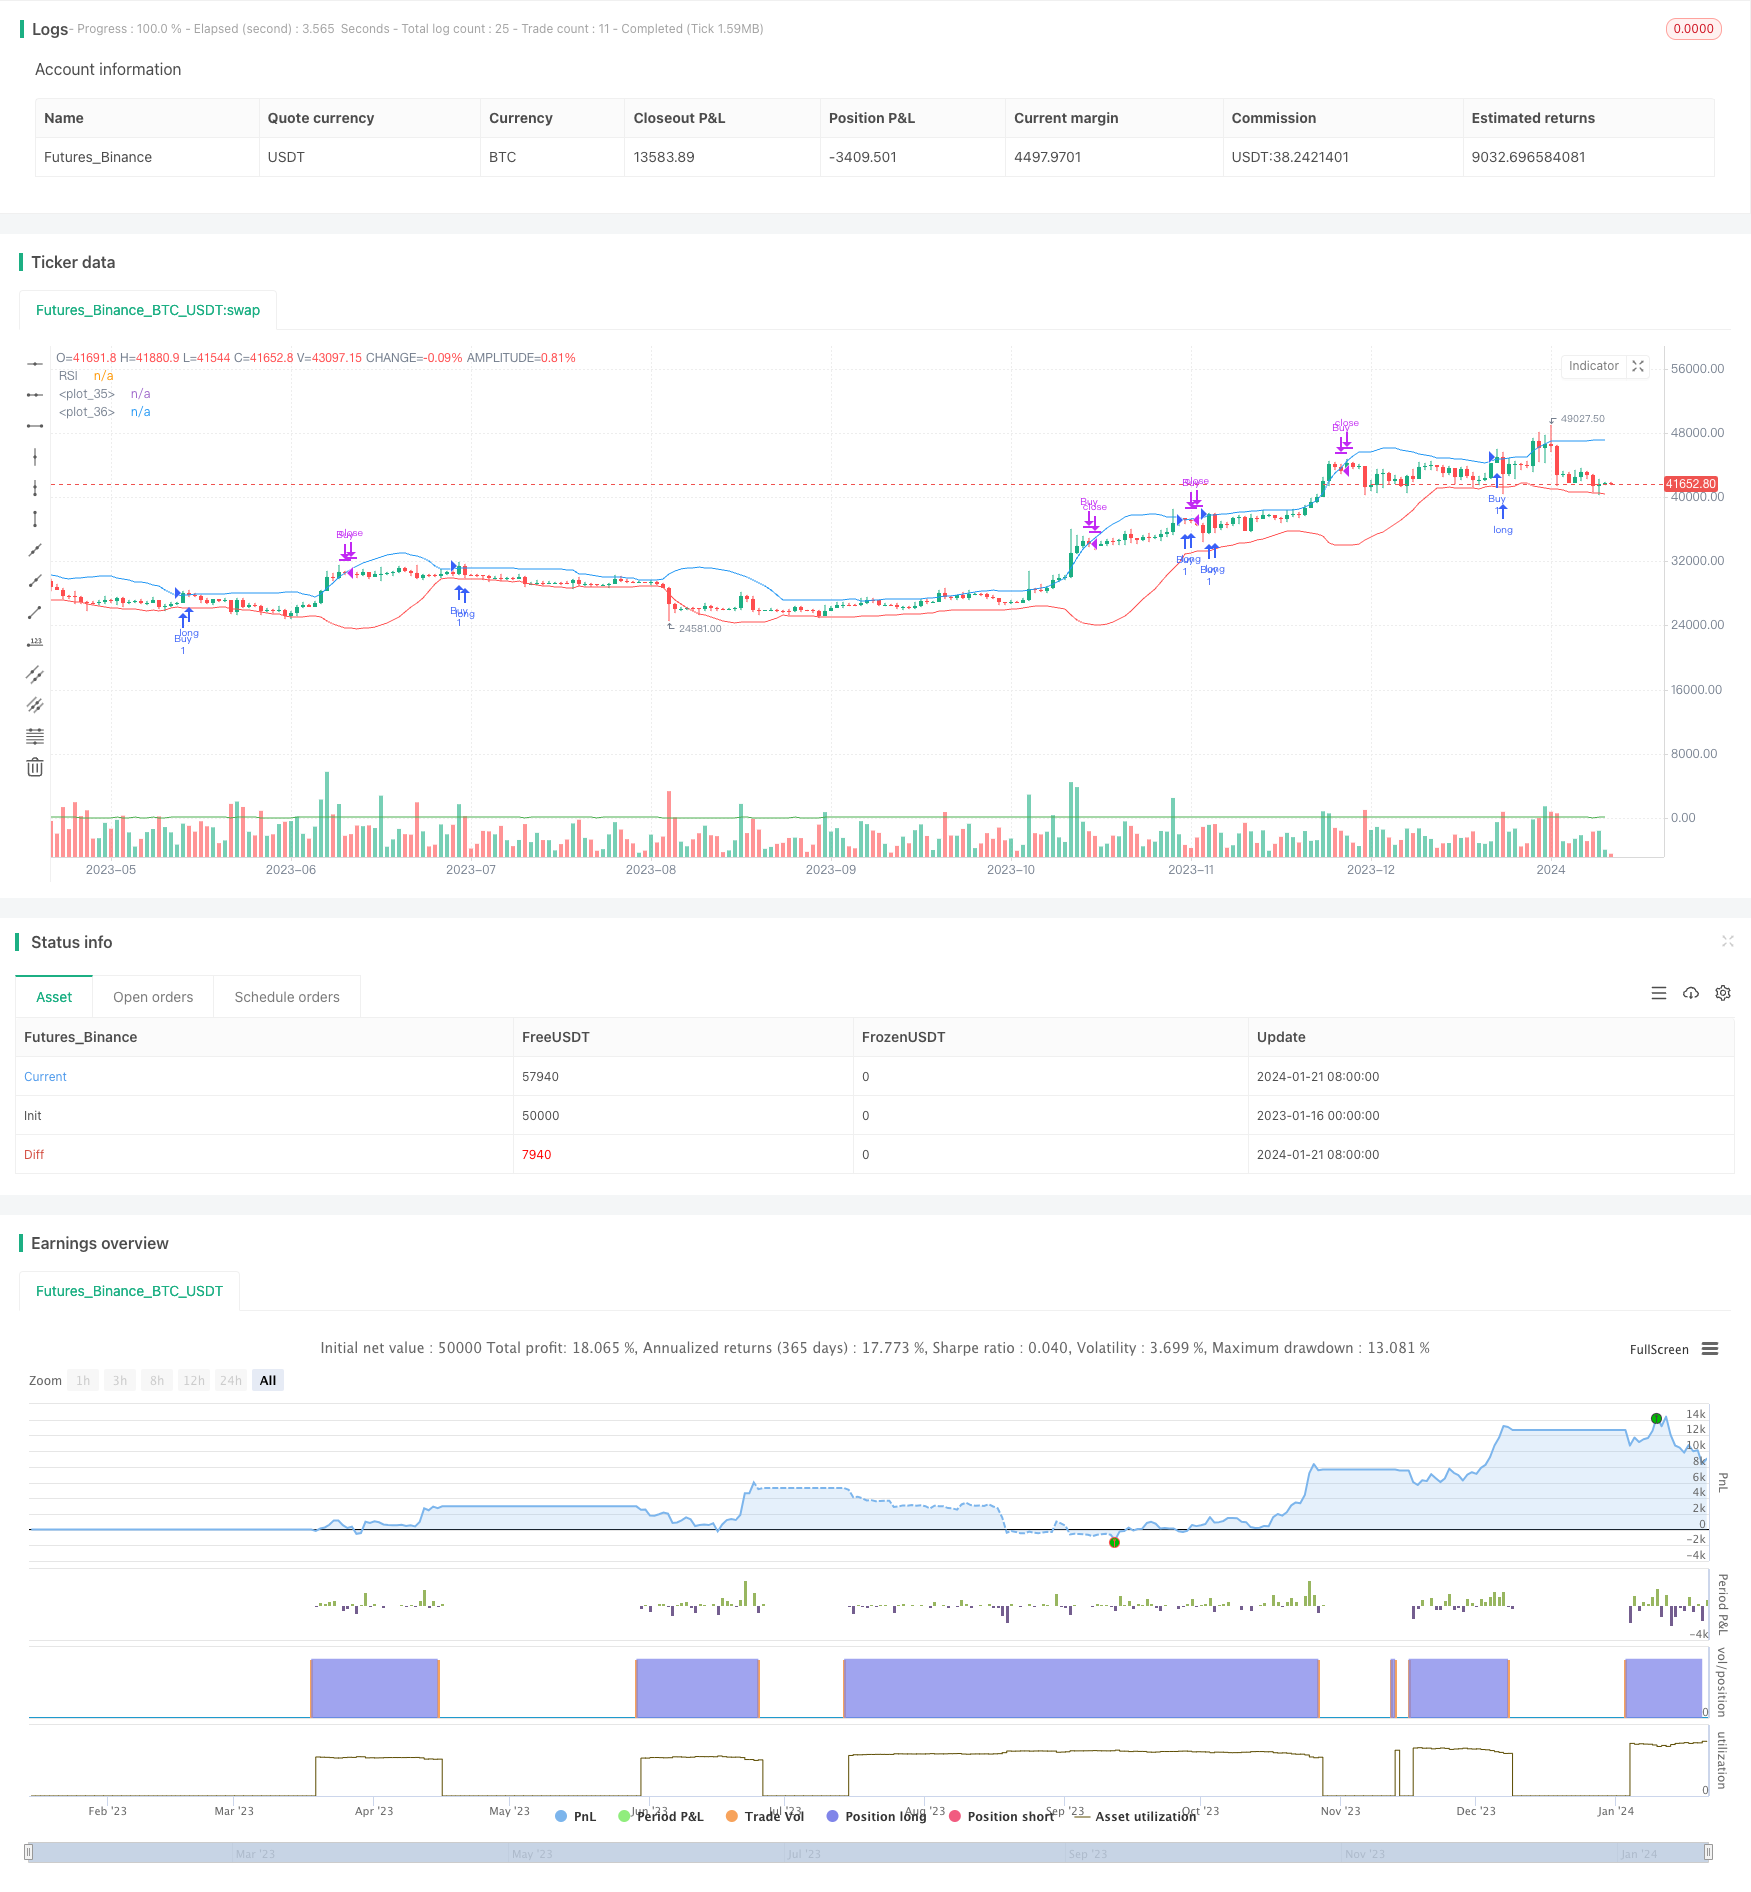
God's Bollinger Bands RSI Trading Strategy
Author: ChaoZhang, Date: 2024-01-23 14:33:13Tags:

Overview
God’s Bollinger Bands RSI trading strategy generates buy signals when the price crosses above the upper Bollinger Band and the RSI is showing an oversold signal; it generates sell signals when the price crosses below the upper Bollinger Band and the RSI is showing an overbought signal. This strategy mainly uses the Bollinger Bands indicator to judge changes in market volatility rhythm and combines with the RSI indicator to detect overbought and oversold phenomena to issue trading signals at inflection points.
Strategy Principle
The core logic of this strategy is based on the following points:
Calculate the 20-period simple moving average of the closing price as the base middle band.
Calculate the upper and lower bands on the basis of the middle band. The upper band is the middle band + 2 times the 20-period standard deviation of the closing price, and the lower band is the middle band - 2 times the 20-period standard deviation of the closing price.
Calculate the 14-period RSI indicator to judge overbought and oversold phenomena. RSI below 20 is oversold and above 70 is overbought.
When the closing price breaks through the upper rail upward and the RSI indicator shows an oversold signal, a buy signal is generated.
When the closing price breaks through the upper rail downward and the RSI indicator shows an overbought signal, a sell signal is generated.
This strategy judges the rhythm and speed of price fluctuations through the Bollinger Bands indicator and detects possible reversal points with the RSI indicator to issue trading signals.
Advantage Analysis
The Bollinger Bands indicator can determine market volatility rhythm and direction, and the RSI indicator judges overbought and oversold phenomena. The combination forms effective trading signals.
The RSI indicator parameters are adjustable and can set different overbought and oversold levels for different markets to avoid wrong signals.
The Bollinger Bands parameters can also be adjusted according to the market volatility range and speed to set appropriate parameters and improve profitability.
Breaking through the upper track forms a buy signal, and breaking through the upper track downward forms a sell signal. The trading logic is simple and easy to understand.
Can be used in stock, forex and cryptocurrency markets.
Risk Analysis
In a sustained upside market, it may cause multiple misjudgments of buy signals. The error signal rate can be reduced by optimizing the RSI parameters.
In a choppy market, the upper and lower tracks of the Bollinger Bands oscillate frequently, which may lead to frequent unprofitable trades. Appropriately loosen the breakout parameters to reduce unnecessary trades.
The code assumes that the criteria for overbought and oversold are fixed, but they should be set according to different market volatility levels.
Both Bollinger Bands and RSI indicators have lags and cannot predict price movements in advance but can only track price changes.
Optimization
According to the characteristics of different markets, adjust the parameters of Bollinger Bands, increase the width of Bollinger Bands, and reduce the probability of erroneous transactions.
RSI parameters also need to be adjusted for different markets, appropriately increase the overbought and oversold criteria to avoid triggering multiple erroneous trading signals.
Increase other indicators for judgment, such as KDJ and MACD, to avoid errors caused by single Bollinger Bands and RSI indicators.
Increase stop loss strategy and set reasonable stop loss points to avoid excessive losses.
Breakout testing or backtesting parameter optimization can be considered to further improve strategy stability.
Summary
God’s Bollinger Bands RSI trading strategy issues trading signals at possible reversal points by judging price volatility speed through Bollinger Bands indicator and overbought and oversold phenomena through RSI indicator. This strategy integrates the advantages of multiple indicators with simple and clear trading logic, and can be widely applied to stock, forex, cryptocurrency and other trading markets as an effective trend trading strategy. But there is also room for improvement, such as adjusting parameters, adding indicators, stop loss mechanism and so on to make the strategy more stable and reliable.
/*backtest
start: 2023-01-16 00:00:00
end: 2024-01-22 00:00:00
period: 1d
basePeriod: 1h
exchanges: [{"eid":"Futures_Binance","currency":"BTC_USDT"}]
*/

//@version=4
strategy("Bollinger Band + RSI Strategy", overlay=true)

// Input variables
numCandlesOutsideBB = input(3, "Number of Candles Outside BB")
numCandlesOutsideUpperBB = input(3, "Number of Candles Outside Upper BB")
rsiLength = input(14, "RSI Length")
rsiOversoldLevel = input(20, "RSI Oversold Level")
rsiOverboughtLevel = input(70, "RSI Overbought Level")

// Bollinger Bands
length = input(20, minval=1, title="BB Length")
mult = input(2.0, minval=0.001, maxval=50, title="BB Standard Deviation")
basis = sma(close, length)
dev = mult * stdev(close, length)
upperBB = basis + dev
lowerBB = basis - dev

// RSI
rsi = rsi(close, rsiLength)

// Buy condition
buyCondition = crossover(close, upperBB) and rsi > rsiOversoldLevel

// Sell condition
sellCondition = crossunder(close, upperBB) and rsi > rsiOverboughtLevel

// Strategy
if buyCondition
    strategy.entry("Buy", strategy.long)
if sellCondition
    strategy.close("Buy")

// Plotting
plot(upperBB, color=color.blue)
plot(lowerBB, color=color.red)
plot(rsi, "RSI", color=color.green)
- Moving Average Crossover Strategy
- Profit Grid Strategy With Oscillation
- Oscillation Breakthrough Strategy Based on Moving Average
- ZigZag Pattern Recognition Short-term Trading Strategy
- Volatility and Trend Tracking Strategy Across Timeframes Based on Williams VIX and DEMA
- Momentum Breakout Strategy Based on Cycle Judgment with Moving Averages
- Money Flow Index 5 Minute Strategy Across Time and Space
- Dual EMA Cross Trend Trading Strategy
- Dynamic MACD Optimization Trading Strategy
- VWAP and RSI Combination Strategy
- EMA Channel and MACD Based Short-term Trading Strategy
- Momentum and Fear Index Crossover Strategy
- Automatic Long/Short Trading Strategy Based on Daily Pivot Points
- Triple Moving Average Quantitative Trading Strategy
- A Momentum Crossover Strategy Based on Exponential Moving Average
- Adaptive Moving Average and Weighted Moving Average Crossover Trading Strategy
- Aggregated Multi-timeframe MACD RSI CCI StochRSI MA Linear Trading Strategy
- Multi-timeframe MACD Trend Following Strategy
- Trend Following Trading Strategy Based on MACD and RSI
- An ATR Channel Breakout Quantitative Trading Strategy