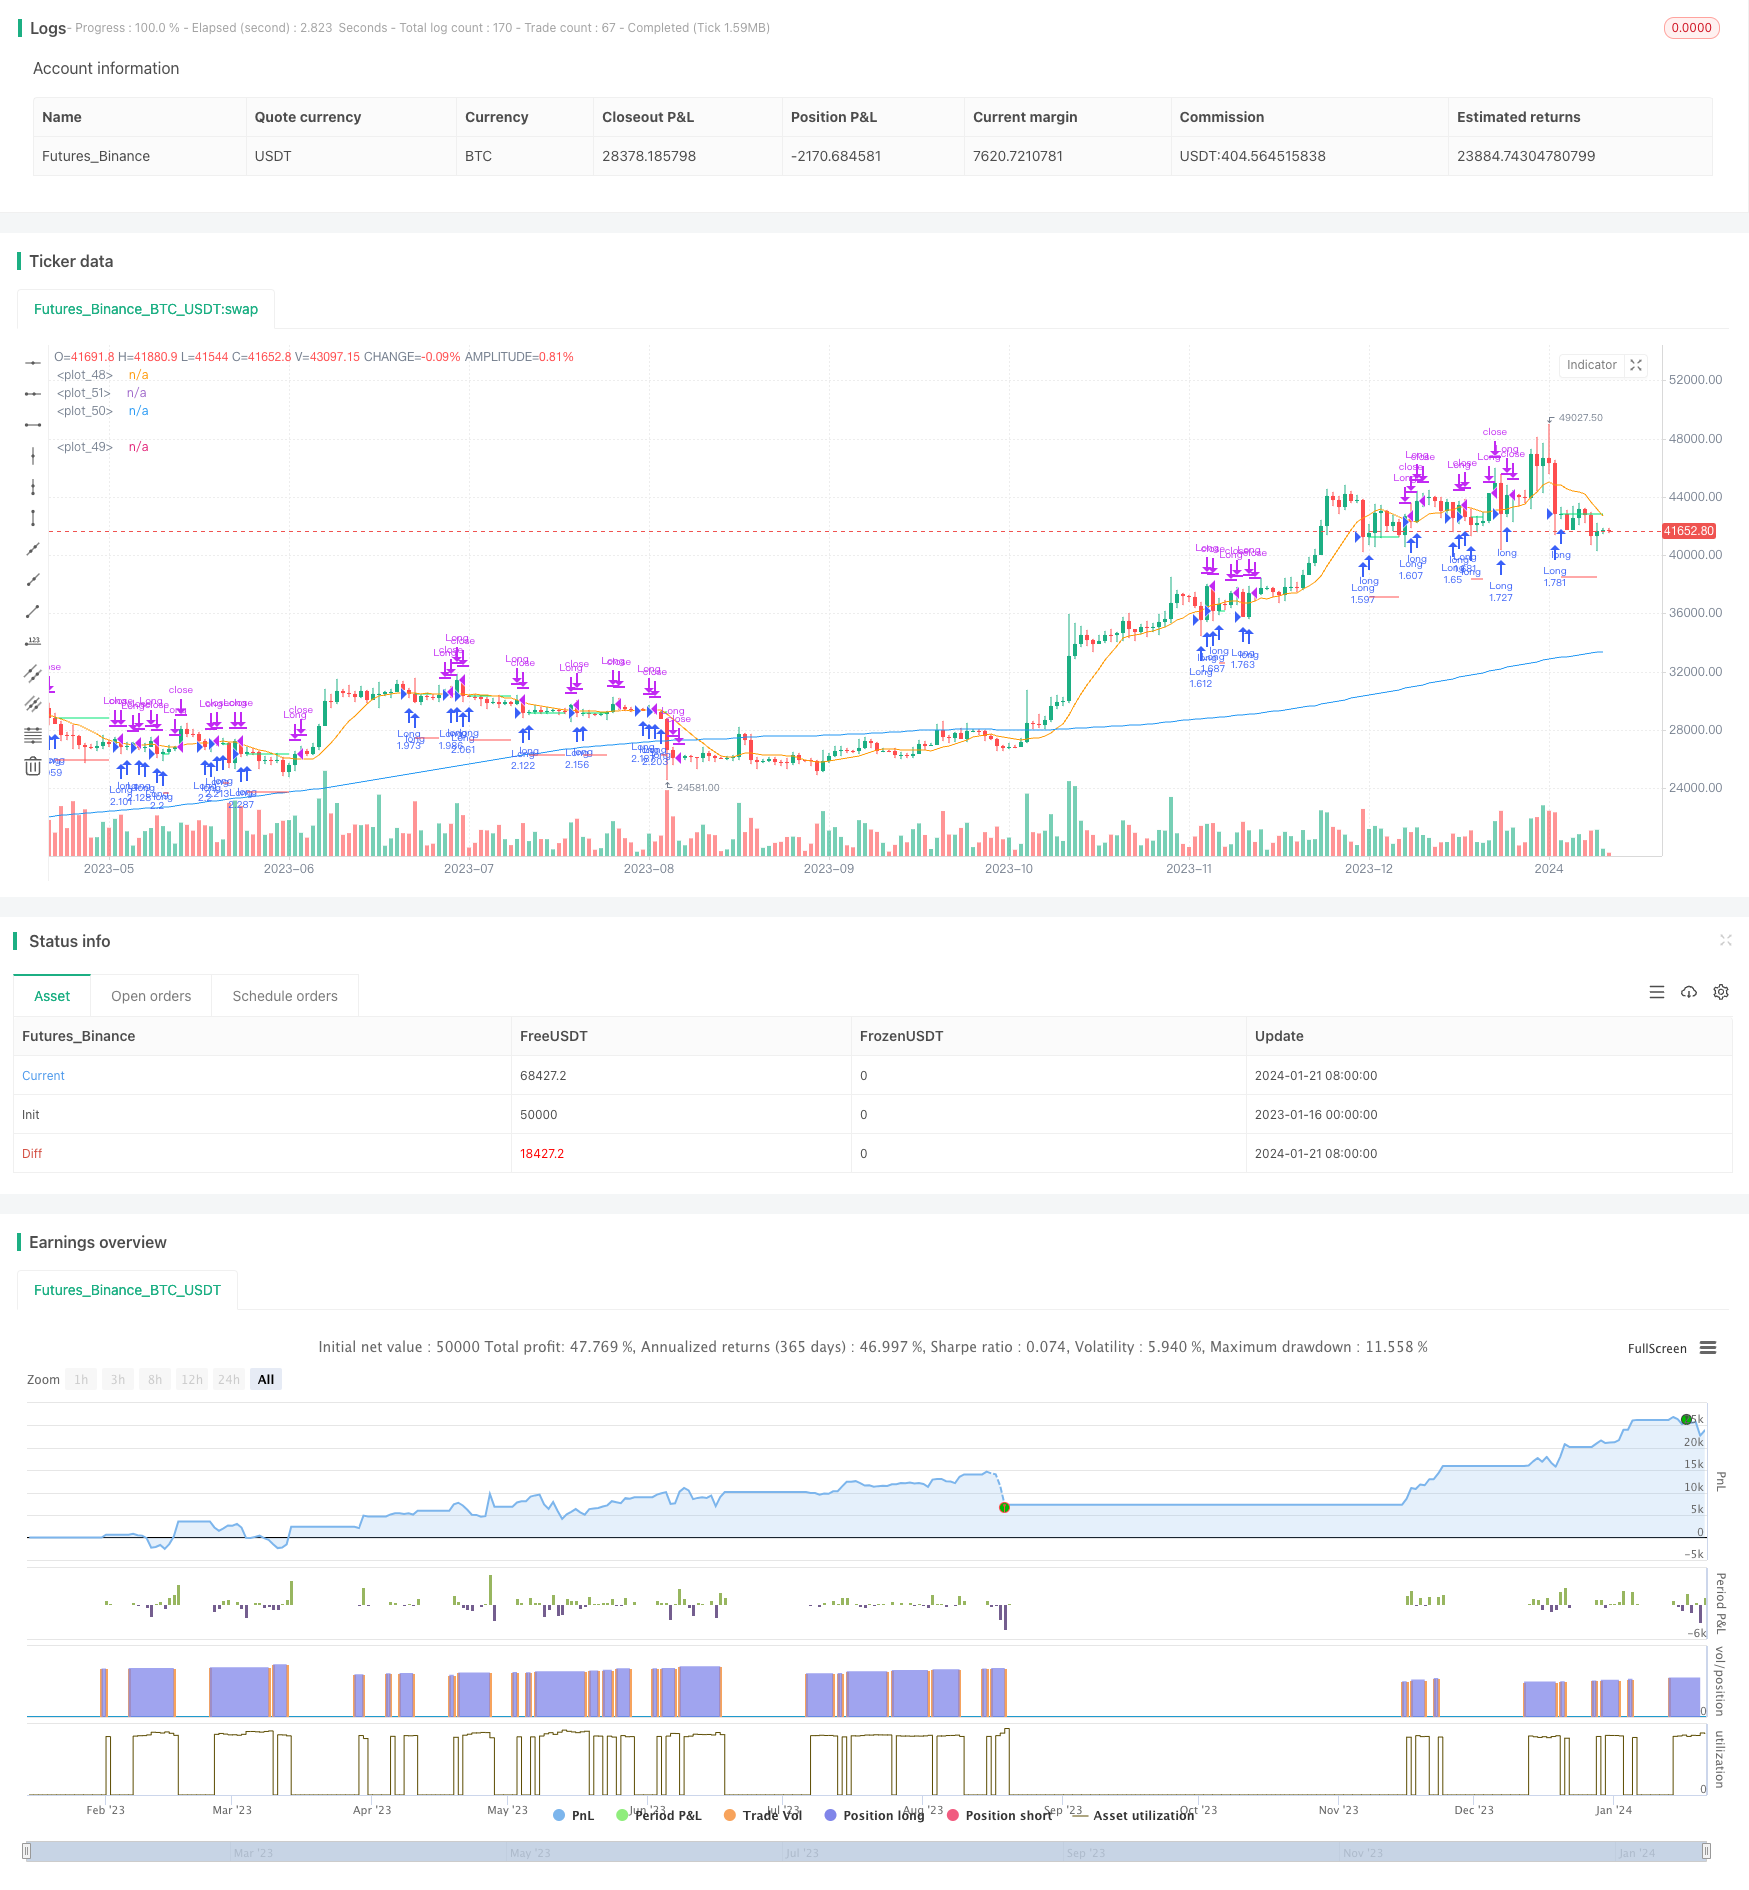
Overview
This strategy aims to identify potential pullback opportunities in the market. It employs a dual moving average system with a long-term moving average (MA1) and a short-term moving average (MA2). The key goal is to go long when the closing price is below MA1 but above MA2, signaling a potential pullback within the overall trend.
Strategy Logic
The strategy utilizes two moving averages: MA1 (longer-term) and MA2 (shorter-term). The logic is that if prices pull back briefly to test support of the longer-term trend, it may present a long opportunity. Specifically, if the closing price remains above the long-term support (MA1), the major trend remains intact. But if the closing price breaks below the short-term MA (MA2) yet still holds above the long-term MA (MA1), it signals a textbook pullback setup. One can go long here with a stop-loss and aim for prices to move back above the short MA.
Advantage Analysis
The advantages of this strategy include:
- Simple to implement and easy to understand with flexible parameter tuning
- Leverages dual MAs to identify major trend and avoid counter-trend trades
- Customizable time filters to avoid abnormal periods
- Adjustable position sizing to suit different risk preferences
- Stop-loss mechanism to limit downside risk
Risk Analysis
The risks to be aware of:
- Failed pullback if prices continue to decline and stop-loss is hit
- Major trend reversal if key support area is broken
- Whipsaws and divergence with volatile price action
- Missing trades from sub-optimal time filters
Some ways to optimize and mitigate risks:
- Optimize MA parameters to improve signal quality
- Fine-tune stop-loss levels to maximize profit while minimizing risks
- Adjust time filters to focus on best trading periods
- Test across different instruments and market environments
Enhancement Opportunities
Some ways to enhance the strategy:
- Optimize MA parameters to find best combinations
- Test different stop-loss mechanisms like trailing or chandelier stops
- Add additional filters like volume or volatility
- Incorporate position sizing rules like adding on golden crosses and reducing on death crosses
- Build in an automated profit-taking mechanism
- Backtest to analyze key metrics and finalize parameters
Conclusion
In summary, this is a straightforward mean reversion pullback strategy. It identifies pullback setups with the dual MA approach and manages risk with adaptive stops. The strategy is easy to grasp and implement with flexible tuning. Next steps are further optimizations around elements like MA parameters, stop-losses, filters to make the strategy more robust.
/*backtest
start: 2023-01-16 00:00:00
end: 2024-01-22 00:00:00
period: 1d
basePeriod: 1h
exchanges: [{"eid":"Futures_Binance","currency":"BTC_USDT"}]
*/

// This source code is subject to the terms of the Mozilla Public License 2.0 at https://mozilla.org/MPL/2.0/
// © ZenAndTheArtOfTrading / www.PineScriptMastery.com
// @version=5
strategy("Simple Pullback Strategy",
     overlay=true,
     initial_capital=50000,
     default_qty_type=strategy.percent_of_equity,
     default_qty_value=100, // 100% of balance invested on each trade
     commission_type=strategy.commission.cash_per_contract,
     commission_value=0.005) // Interactive Brokers rate

// Get user input
i_ma1           = input.int(title="MA 1 Length", defval=200, step=10, group="Strategy Parameters", tooltip="Long-term MA")
i_ma2           = input.int(title="MA 2 Length", defval=10, step=10, group="Strategy Parameters", tooltip="Short-term MA")
i_stopPercent   = input.float(title="Stop Loss Percent", defval=0.10, step=0.1, group="Strategy Parameters", tooltip="Failsafe Stop Loss Percent Decline")
i_lowerClose    = input.bool(title="Exit On Lower Close", defval=false, group="Strategy Parameters", tooltip="Wait for a lower-close before exiting above MA2")
i_startTime     = input(title="Start Filter", defval=timestamp("01 Jan 1995 13:30 +0000"), group="Time Filter", tooltip="Start date & time to begin searching for setups")
i_endTime       = input(title="End Filter", defval=timestamp("1 Jan 2099 19:30 +0000"), group="Time Filter", tooltip="End date & time to stop searching for setups")

// Get indicator values
ma1 = ta.sma(close, i_ma1)
ma2 = ta.sma(close, i_ma2)

// Check filter(s)
f_dateFilter =true

// Check buy/sell conditions
var float buyPrice = 0
buyCondition    = close > ma1 and close < ma2 and strategy.position_size == 0 and f_dateFilter
sellCondition   = close > ma2 and strategy.position_size > 0 and (not i_lowerClose or close < low[1])
stopDistance    = strategy.position_size > 0 ? ((buyPrice - close) / close) : na
stopPrice       = strategy.position_size > 0 ? buyPrice - (buyPrice * i_stopPercent) : na
stopCondition   = strategy.position_size > 0 and stopDistance > i_stopPercent

// Enter positions
if buyCondition
    strategy.entry(id="Long", direction=strategy.long)

if buyCondition[1]
    buyPrice := open

// Exit positions
if sellCondition or stopCondition
    strategy.close(id="Long", comment="Exit" + (stopCondition ? "SL=true" : ""))
    buyPrice := na

// Draw pretty colors
plot(buyPrice, color=color.lime, style=plot.style_linebr)
plot(stopPrice, color=color.red, style=plot.style_linebr, offset=-1)
plot(ma1, color=color.blue)
plot(ma2, color=color.orange)