Dynamic Dual EMA Trailing Stop Strategy
Author: ChaoZhang, Date: 2024-01-24 15:13:07Tags:

Overview
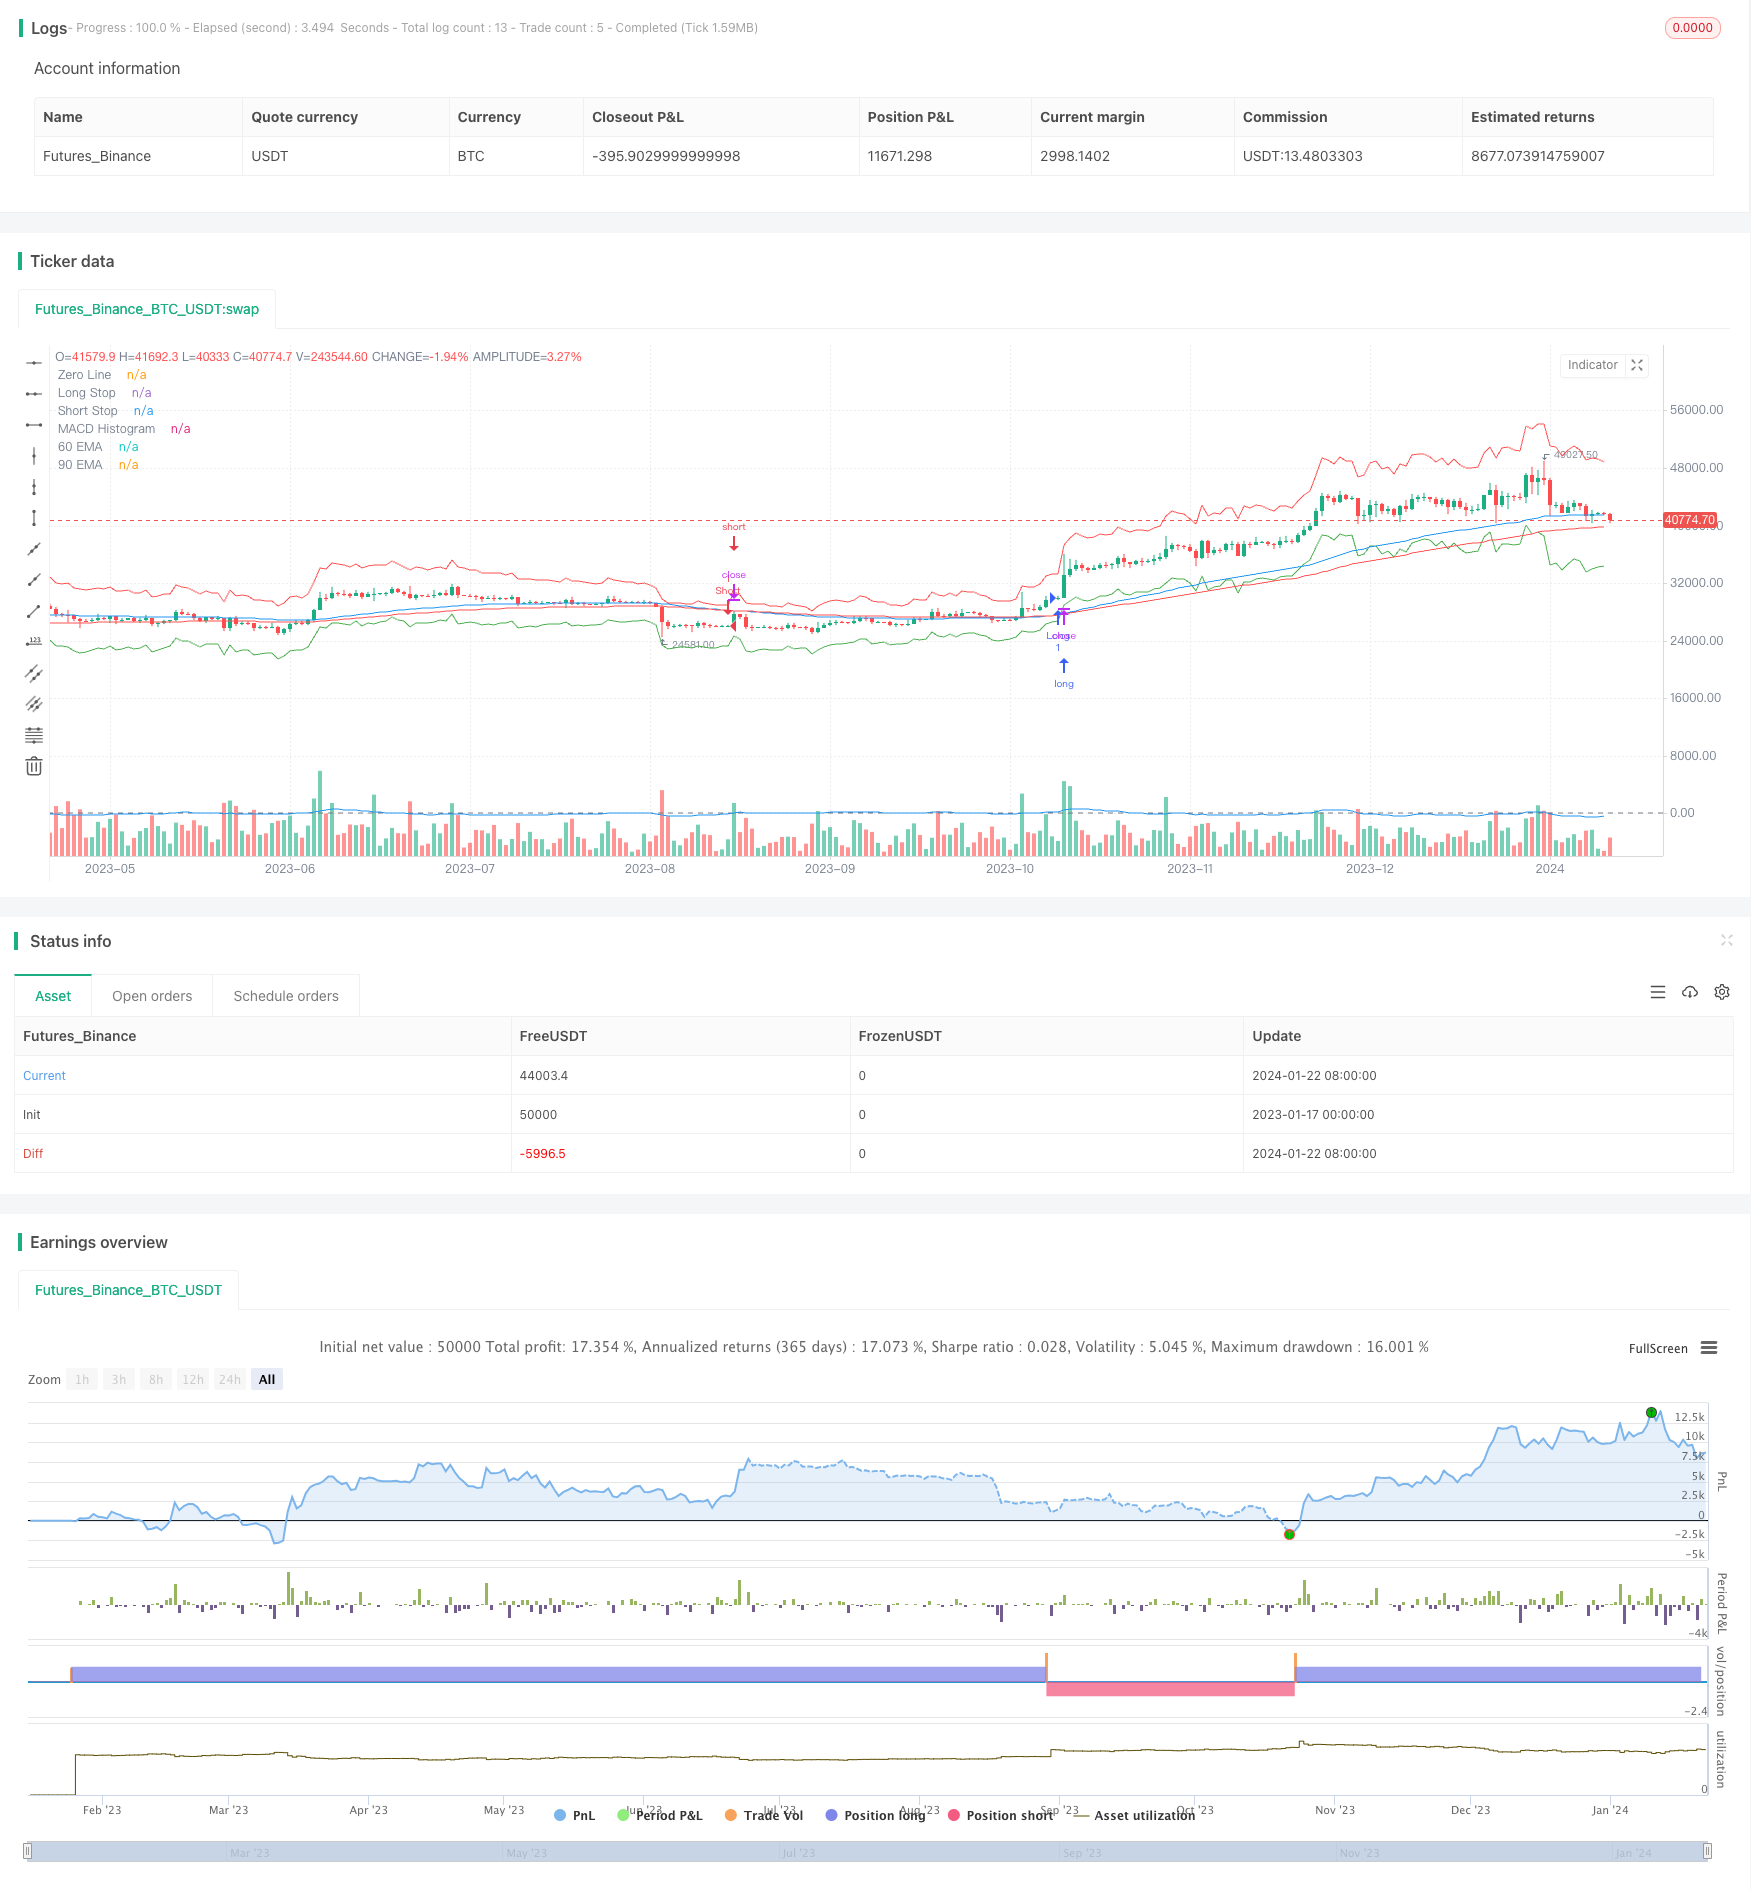
This strategy aims to exploit potential trend reversals or continuations using Exponential Moving Averages (EMAs) and a trailing stop based on the Chande Dynamic Convergence Divergence (CDC) Average True Range method. The strategy combines multiple indicators to determine entry timing and sets stop loss and take profit levels based on market volatility to control risk while capturing new trends.
Strategy Logic
This strategy uses 60-period and 90-period dual EMAs to determine trend direction. A crossover where the shorter period EMA moves above the longer period EMA gives a bullish signal. At the same time, a MACD line crossover above its signal line can confirm the bullish view. Entry requires the price to be above the previously calculated CDC trailing stop level.
The exit rules are: close the position when price hits the ATR-based take profit level or falls below the CDC trailing stop loss level.
Advantage Analysis
This strategy combines dual EMAs to judge the main trend direction and MACD to confirm entry timing, avoiding false breakouts. Both the trailing stop and profit target levels are calculated based on market volatility for effective risk management. Whether a trend reverses or continues, this strategy can seize opportunities in a timely manner.
In addition, the input parameters of this strategy are customizable. Users can adjust the EMA periods, ATR period and CDC multiplier according to their own trading style.
Risk Analysis
The biggest risk of this strategy is incorrect trend judgment. When the market is consolidating, EMAs can easily give wrong signals. At this time, MACD’s confirmation role is especially important. In addition, appropriately increasing the CDC stop loss multiplier is needed to deal with large price gaps caused by sudden events.
Optimization Directions
- Test different combinations of EMA period parameters to find the optimal setting
- Test different CDC stop loss multiplier sizes
- Try incorporating other indicators to filter entry timing
- Add mechanisms to handle sudden market events
Summary
This strategy makes good use of the advantages of trend and volatility indicators to identify potential opportunities in securities. Through parameter optimization and mechanism improvements, this strategy has the potential to further enhance stability and profitability. It provides quantitative traders with a reliable and scalable strategic framework.
/*backtest
start: 2023-01-17 00:00:00
end: 2024-01-23 00:00:00
period: 1d
basePeriod: 1h
exchanges: [{"eid":"Futures_Binance","currency":"BTC_USDT"}]
*/

//@version=5
strategy("Improved EMA & CDC Trailing Stop Strategy", overlay=true)

// Define the inputs
ema60Period = input(60, title="EMA 60 Period")
ema90Period = input(90, title="EMA 90 Period")
atrPeriod = input(24, title="CDC ATR Period")
multiplier = input(4.0, title="CDC Multiplier")
profitTargetMultiplier = input(2.0, title="Profit Target Multiplier (ATR)")

// Calculate EMAs
ema60 = ta.ema(close, ema60Period)
ema90 = ta.ema(close, ema90Period)

// Calculate ATR
atr = ta.atr(atrPeriod)

// MACD calculation
[macdLine, signalLine, _] = ta.macd(close, 12, 26, 9)

// Define the trailing stop and profit target
longStop = close - multiplier * atr
shortStop = close + multiplier * atr
longProfitTarget = close + profitTargetMultiplier * atr
shortProfitTarget = close - profitTargetMultiplier * atr

// Entry conditions
longCondition = close > ema60 and ema60 > ema90 and macdLine > signalLine and close > longStop
shortCondition = close < ema60 and ema60 < ema90 and macdLine < signalLine and close < shortStop

// Exit conditions based on profit target
longProfitCondition = close >= longProfitTarget
shortProfitCondition = close <= shortProfitTarget

// Plot the EMAs, Stops, and MACD for visualization
plot(ema60, color=color.blue, title="60 EMA")
plot(ema90, color=color.red, title="90 EMA")
plot(longStop, color=color.green, title="Long Stop", style=plot.style_linebr)
plot(shortStop, color=color.red, title="Short Stop", style=plot.style_linebr)
hline(0, "Zero Line", color=color.gray)
plot(macdLine - signalLine, color=color.blue, title="MACD Histogram")

// Strategy execution using conditional blocks
if longCondition
    strategy.entry("Long", strategy.long)
if shortCondition
    strategy.entry("Short", strategy.short)

// Exit based on profit target and trailing stop
if longProfitCondition or close < longStop
    strategy.close("Long")
if shortProfitCondition or close > shortStop
    strategy.close("Short")
- Momentum Moving Average Consolidation Strategy
- Fast QQE Crossover Trading Strategy Based on Trend Filter
- Adaptive Moving Average Tracking Strategy
- Scalping Strategy in Trend Reversal Market
- Bidirectional EMA Cross Quant Trading Strategy
- EMA Intraday Scalping Strategy
- Compound Stop Loss and Take Profit Strategy Based on Random Entry
- Bandpass Filter Reversed Strategy
- Dual Moving Average Crossover Trading Strategy
- RSI Combined with Bollinger Bands and Dynamic Support/Resistance Quantitative Strategy
- Multi-indicator Combined Quantitative Trading Strategy
- Contrarian Donchian Channel Touch Entry Strategy with Post-Stop Loss Pause and Trailing Stop Loss
- Intraday Single Candle Indicator Combo Short Term Trading Strategy
- Moving Average Crossover Trading Strategy
- RSI Bollinger Bands Trading Strategy
- Trend Following Strategy Based on Dual EMA
- Dual Moving Average Breakout Strategy
- RSI and Moving Average Breakout Strategy
- EMA Tracking Strategy
- Trend Following Strategy Based on Moving Average