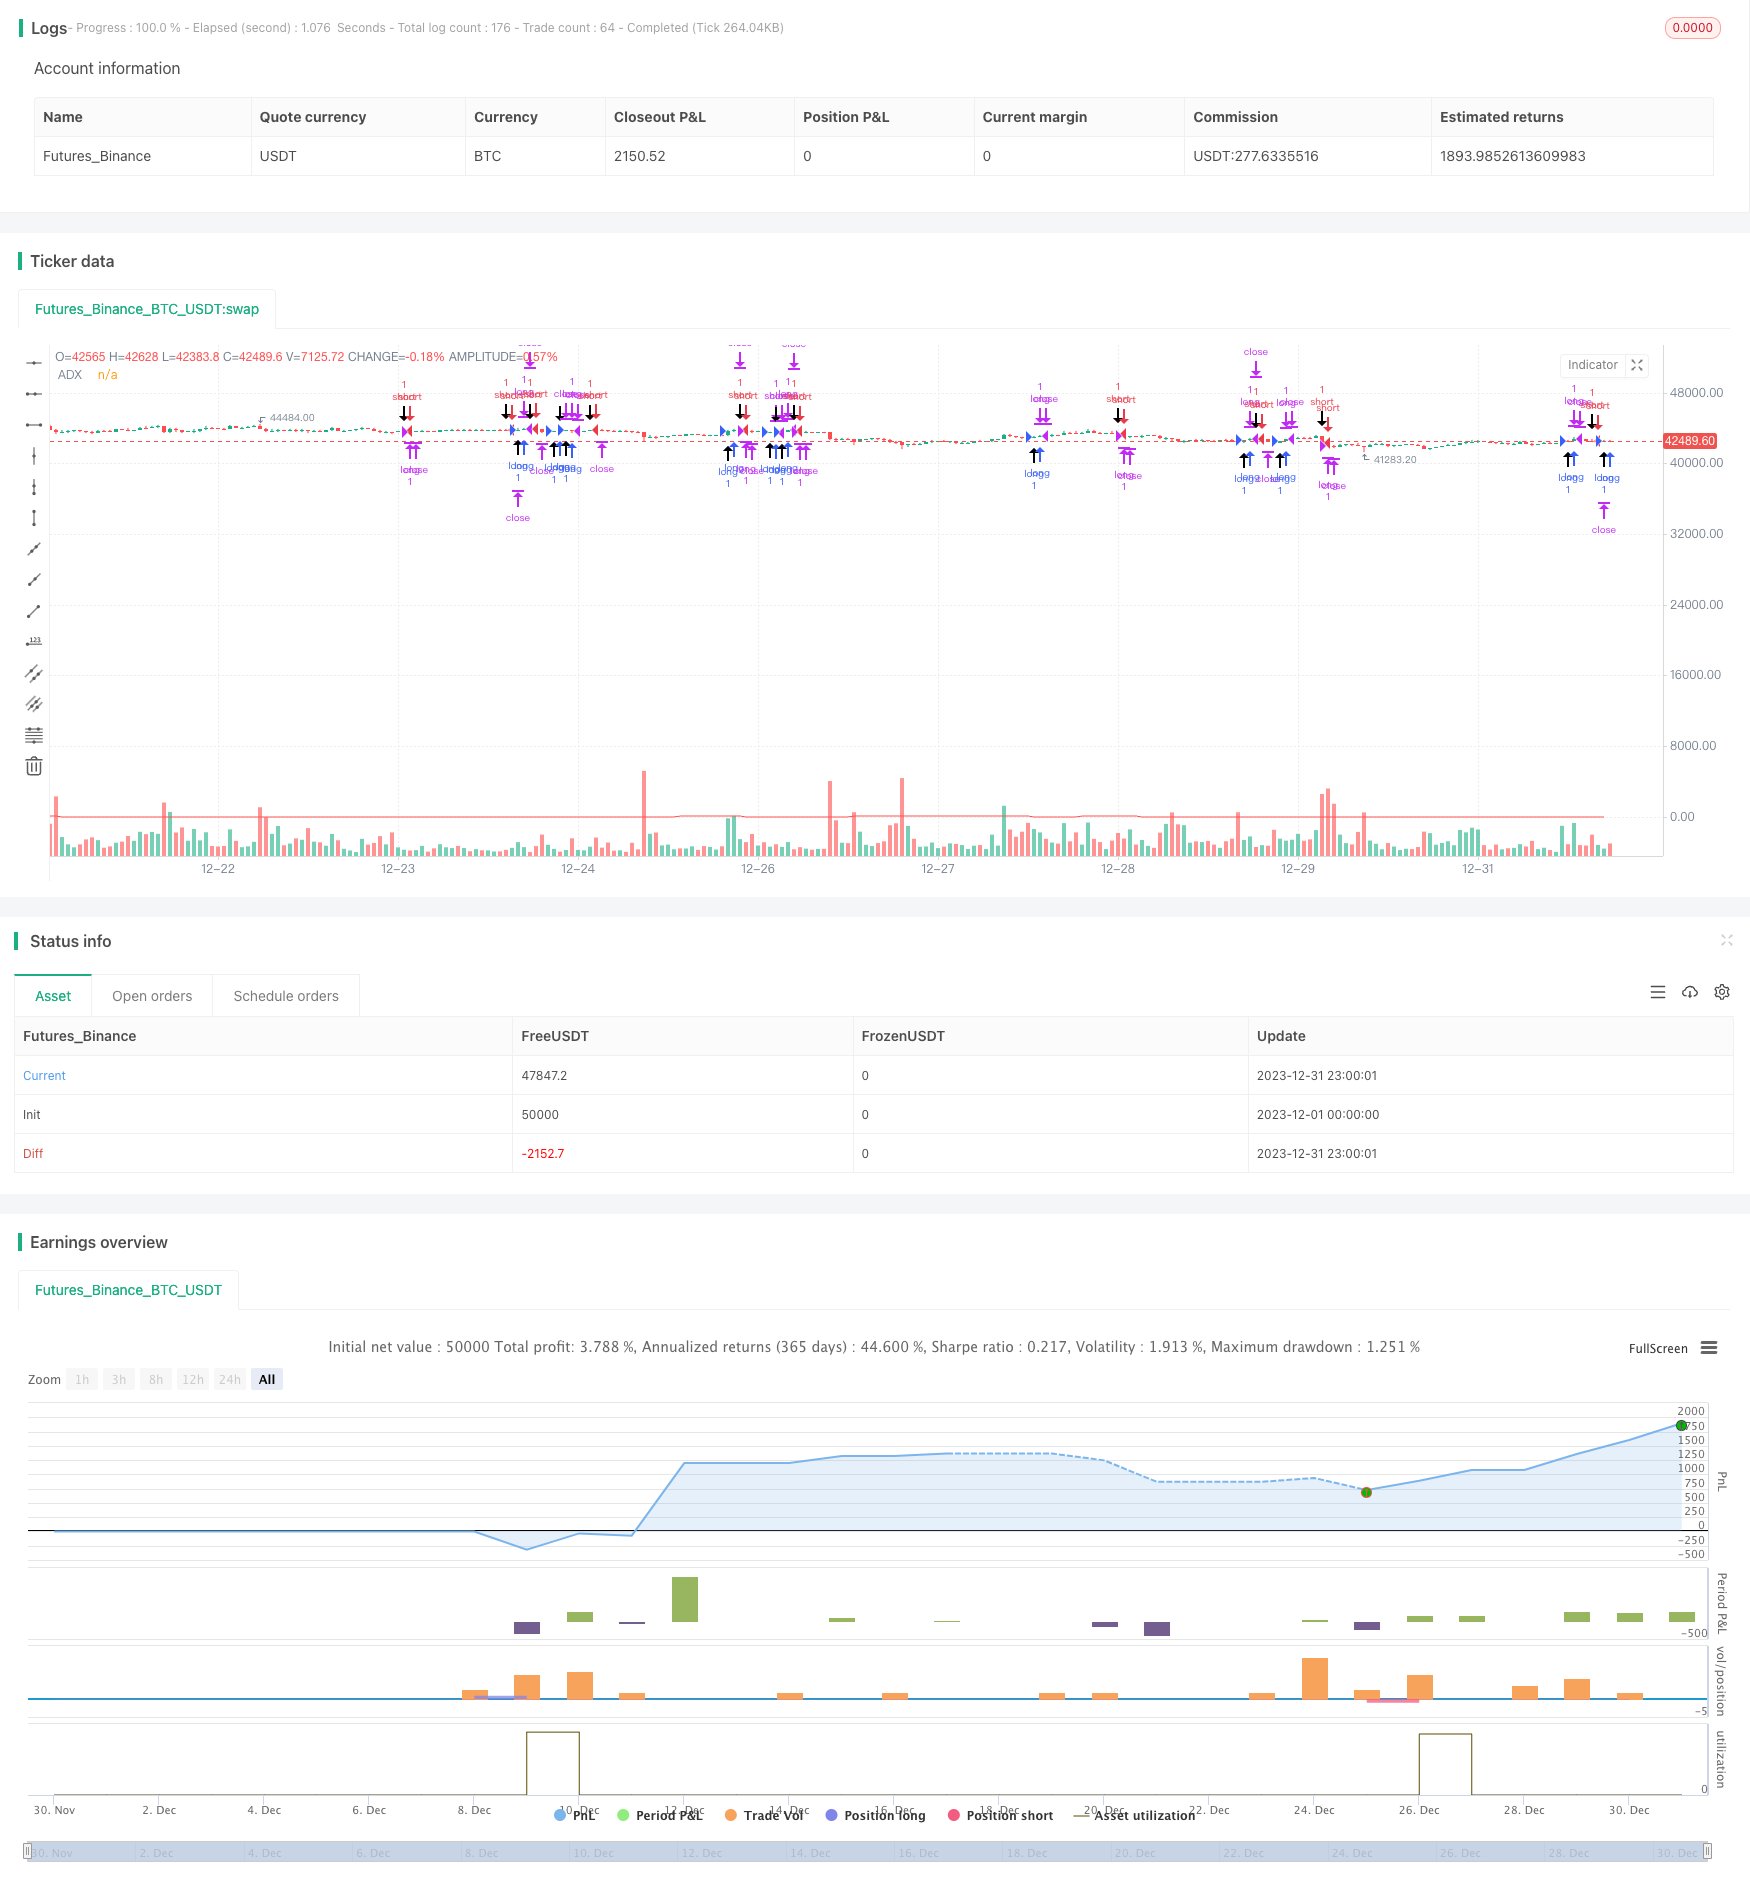
Crude Oil ADX Trend Following Strategy
Author: ChaoZhang, Date: 2024-01-25 15:18:15Tags:

Overview
This strategy is adapted from Kevin Davey’s free crude oil futures trading strategy. It utilizes the ADX indicator to determine the trend in the crude oil market and, combined with the price breakout principle, implements a simple and practical automated trading strategy for crude oil.
Strategy Principle
- Calculate the 14-period ADX indicator
- When ADX>10, the market is considered to have a trend
- If the closing price is higher than the closing price 65 bars ago, it indicates a price breakout and a long signal
- If the closing price is lower than the closing price 65 bars ago, it indicates a price breakout and a short signal
- Set stop loss and take profit after entering the position
The strategy mainly relies on the ADX indicator to determine the trend, and generates trading signals based on fixed-cycle price breakouts under trend conditions. The overall strategy logic is very simple and clear.
Advantage Analysis
- Use ADX to determine trends and avoid missing trend opportunities
- Fixed-cycle price breakouts generate signals with good backtest results
- Intuitive and simple code, easy to understand and modify
- Kevin Davey’s multi-year live trading verification, non-curve fitting
Risk Analysis
- As the main indicator, ADX is sensitive to parameter selection and breakout cycle selection
- Fixed-cycle breakouts may miss some opportunities
- Improper stop loss and take profit settings may increase losses
- There may be differences between live trading and backtest results
Optimization Directions
- Optimize ADX parameters and breakout cycles
- Increase dynamic adjustment of position size
- Continuously modify and improve the strategy based on backtest results and live trading verification
- Introduce machine learning and deep learning techniques for strategy optimization
Summary
Overall this is a very practical crude oil trading strategy. It uses the ADX indicator to determine the trend very reasonably. The price breakout principle is simple and effective with good backtest results. At the same time, as Kevin Davey’s public free strategy, it has very strong reliability in actual combat. Although there is still room for improvement in the strategy, it is a very suitable choice for beginners and small capital traders to get started and practice.
/*backtest
start: 2023-12-01 00:00:00
end: 2023-12-31 23:59:59
period: 1h
basePeriod: 15m
exchanges: [{"eid":"Futures_Binance","currency":"BTC_USDT"}]
*/

// Strategy idea coded from EasyLanguage to Pinescript
//@version=5
strategy("Kevin Davey Crude free crude oil strategy", shorttitle="CO Fut", format=format.price, precision=2, overlay = true, calc_on_every_tick = true)
adxlen = input(14, title="ADX Smoothing")
dilen = input(14, title="DI Length")
dirmov(len) =>
	up = ta.change(high)
	down = -ta.change(low)
	plusDM = na(up) ? na : (up > down and up > 0 ? up : 0)
	minusDM = na(down) ? na : (down > up and down > 0 ? down : 0)
	truerange = ta.rma(ta.tr, len)
	plus = fixnan(100 * ta.rma(plusDM, len) / truerange)
	minus = fixnan(100 * ta.rma(minusDM, len) / truerange)
	[plus, minus]
adx(dilen, adxlen) =>
	[plus, minus] = dirmov(dilen)
	sum = plus + minus
	adx = 100 * ta.rma(math.abs(plus - minus) / (sum == 0 ? 1 : sum), adxlen)
sig = adx(dilen, adxlen)
plot(sig, color=color.red, title="ADX")

buy = sig > 10 and (close - close[65]) > 0 and (close - close[65])[1] < 0
sell = sig > 10 and (close - close[65]) < 0 and (close - close[65])[1] > 0

plotshape(buy, style = shape.arrowup, location = location.belowbar,size = size.huge)
plotshape(sell, style = shape.arrowdown, location = location.abovebar,size = size.huge)

if buy
	strategy.entry("long", strategy.long)
if sell
	strategy.entry("short", strategy.short)

if strategy.position_size != 0
	strategy.exit("long", profit = 450, loss = 300)
	strategy.exit("short", profit = 450, loss = 300)


// GetTickValue() returns the currency value of the instrument's
// smallest possible price movement.
GetTickValue() =>
    syminfo.mintick * syminfo.pointvalue

// On the last historical bar, make a label to display the
// instrument's tick value
if barstate.islastconfirmedhistory
    label.new(x=bar_index + 1, y=close, style=label.style_label_left,
         color=color.black, textcolor=color.white, size=size.large,
         text=syminfo.ticker + " has a tick value of:\n" +
             syminfo.currency + " " + str.tostring(GetTickValue()))
- Stochastic Supertrend Tracking Stop Loss Trading Strategy
- Dual Reversal Oscillating Band Trend Following Strategy
- Trend Following Strategy Based on DMI and RSI
- Quantitative Support and Resistance Oscillation Strategy
- Trend-Following Strategy with 3 EMAs, DMI and MACD
- Dual Indicators Breakthrough Strategy
- Pete Wave Trading System Strategy
- Quantitative Strategy Based on Exponential Moving Average and Volume Weighting
- Origix Ashi Strategy Based on Smoothed Moving Average
- BlackBit Trader XO Macro Trend Scanner Strategy
- MT-Coordination Trading Strategy
- Combo Strategy of Double Factors Reversal and Improved Price Volume Trend
- Trend Angle Moving Average Crossover Strategy
- This strategy makes trading decisions based on the trend of MACD Histogram
- Momentum Oscillator & 123 Pattern Strategy
- Backtesting Strategy Based on Fisher Transform Indicator
- Oscillation Spectrum Moving Average Trading Strategy
- Reversal Trading Strategy Based on Moving Average Range
- Kalman Filter Based Trend Tracking Strategy
- Seasonal Reversal Intertemporal Trading Strategy