Quantitative Support and Resistance Oscillation Strategy
Author: ChaoZhang, Date: 2024-01-25 15:53:06Tags:

Overview
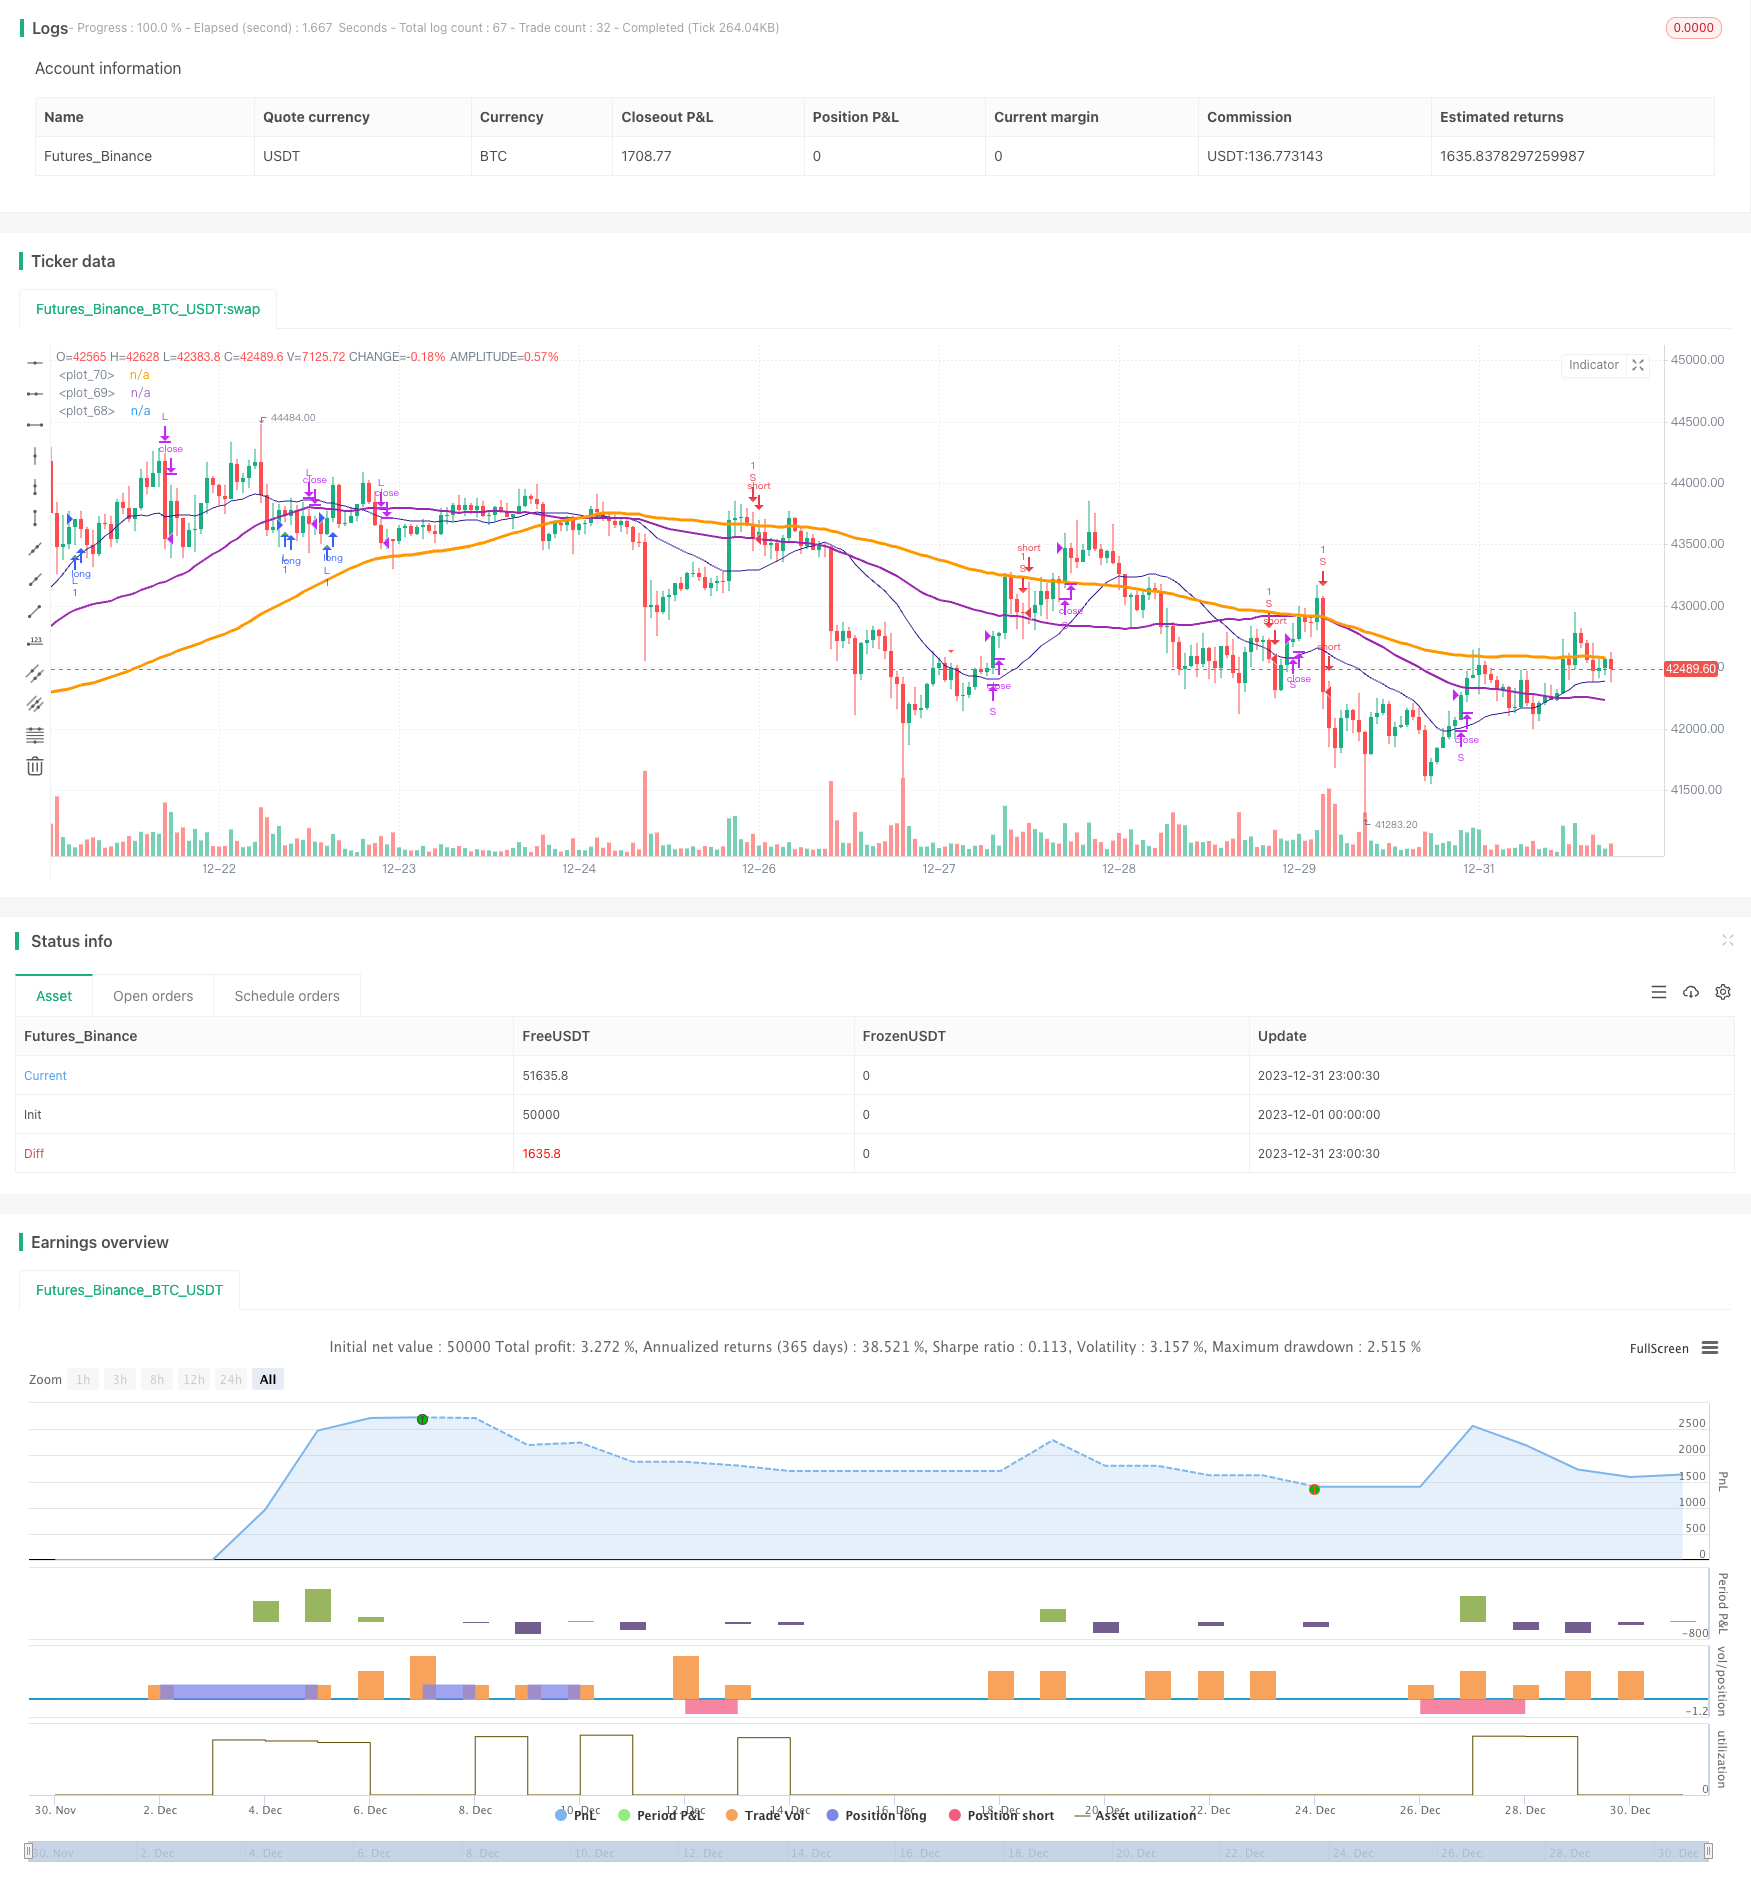
This strategy combines RSI crossover strategy with optimized stop loss strategy to achieve precise logic control and accurate stop loss and take profit. Meanwhile, by introducing signal optimization, it can better grasp the trend and achieve reasonable capital management.
Strategy Principle
- RSI indicator determines overbought and oversold area. Combined with K and D value golden cross and dead cross to form trading signals.
- Introduces candlestick pattern recognition to assist in judging trend signals to avoid wrong trades.
- SMA lines assist in determining trend direction. Uptrend when short period SMA breaks out upper long period SMA.
Advantage Analysis
- RSI parameter optimization determines overbought and oversold area precisely to avoid wrong trades.
- STO parameter optimization, smoothness adjustment filters out noise and improves signal quality.
- Heikin-Ashi technology introduced to recognize candlestick direction change and ensure accurate trading signals.
- SMA lines assist judging major trend direction, avoids trading against the trend.
- Stop loss strategy locks in maximum profit for each trade.
Risk Analysis
- Facing greater risk when market continues going down.
- High trading frequency increases trading cost and slippage cost.
- RSI tends to generate false signals, needs filtering by other indicators.
Strategy Optimization
- Adjust RSI parameters, optimize overbought oversold judgement.
- Adjust STO parameters, smoothness and period to improve signal quality.
- Adjust moving average period to optimize trend judgement.
- Introduce more technical indicators to improve signal accuracy.
- Optimize stop loss ratio to reduce single trade risk.
Conclusion
The strategy integrates advantages of multiple mainstream technical indicators. Through parameter optimization and logic refinement, it balances trading signal quality and stop loss. With certain versatility and steady profitability. Further optimization can improve win rate and profitability.
/*backtest
start: 2023-12-01 00:00:00
end: 2023-12-31 23:59:59
period: 1h
basePeriod: 15m
exchanges: [{"eid":"Futures_Binance","currency":"BTC_USDT"}]
*/

//@version=4
//study(title="@sentenzal strategy", shorttitle="@sentenzal strategy", overlay=true)
strategy(title="@sentenzal strategy", shorttitle="@sentenzal strategy", overlay=true  )
smoothK = input(3, minval=1)
smoothD = input(3, minval=1)
lengthRSI = input(14, minval=1)
lengthStoch = input(14, minval=1)
overbought = input(80, minval=1)
oversold = input(20, minval=1)
smaLengh = input(100, minval=1)
smaLengh2 = input(50, minval=1)
smaLengh3 = input(20, minval=1)

src = input(close, title="RSI Source")
testStartYear = input(2017, "Backtest Start Year")
testStartMonth = input(1, "Backtest Start Month")
testStartDay = input(1, "Backtest Start Day")
testPeriodStart = timestamp(testStartYear,testStartMonth,testStartDay,0,0)
testPeriod() =>
    time >= testPeriodStart ? true : false

rsi1 = rsi(src, lengthRSI)
k = sma(stoch(rsi1, rsi1, rsi1, lengthStoch), smoothK)
d = sma(k, smoothD)
crossBuy = crossover(k, d) and k < oversold
crossSell = crossunder(k, d) and k > overbought

dcLower = lowest(low, 10)
dcUpper = highest(high, 10)


heikinashi_close = security(heikinashi(syminfo.tickerid), timeframe.period, close)
heikinashi_open = security(heikinashi(syminfo.tickerid), timeframe.period, open)
heikinashi_low = security(heikinashi(syminfo.tickerid), timeframe.period, low)
heikinashi_high = security(heikinashi(syminfo.tickerid), timeframe.period, high)
heikinashiPositive = heikinashi_close >= heikinashi_open

heikinashiBuy = heikinashiPositive == true and heikinashiPositive[1] == false  and heikinashiPositive[2] == false
heikinashiSell = heikinashiPositive == false and heikinashiPositive[1] == true and heikinashiPositive[2] == true

//plotshape(heikinashiBuy, style=shape.arrowup, color=green, location=location.belowbar, size=size.tiny)
//plotshape(heikinashiSell, style=shape.arrowdown, color=red, location=location.abovebar, size=size.tiny)

buy = (crossBuy == true or crossBuy[1] == true or crossBuy[2] == true) and (heikinashiBuy == true or heikinashiBuy[1] == true or heikinashiBuy[2] == true)
sell = (crossSell == true or crossSell[1] == true or crossSell[2] == true) and (heikinashiSell == true or heikinashiSell[1] == true or heikinashiSell[2] == true)

mult = timeframe.period == '15' ? 4 : 1
mult2 = timeframe.period == '240' ? 0.25 : mult

movingAverage = sma(close, round(smaLengh))
movingAverage2 = sma(close, round(smaLengh2))
movingAverage3 = sma(close, round(smaLengh3))

uptrend = movingAverage < movingAverage2 and movingAverage2 < movingAverage3 and close > movingAverage
downtrend = movingAverage > movingAverage2 and movingAverage2 > movingAverage3 and close < movingAverage

signalBuy = (buy[1] == false and buy[2] == false and buy == true) and uptrend
signalSell = (sell[1] == false and sell[2] == false and sell == true) and downtrend

takeProfitSell = (buy[1] == false and buy[2] == false and buy == true) and uptrend == false
takeProfitBuy = (sell[1] == false and sell[2] == false and sell == true)  and uptrend

plotshape(signalBuy, style=shape.triangleup, color=green, location=location.belowbar, size=size.tiny)
plotshape(signalSell, style=shape.triangledown, color=red, location=location.abovebar, size=size.tiny)


plot(movingAverage, linewidth=3, color=orange, transp=0)
plot(movingAverage2, linewidth=2, color=purple, transp=0)
plot(movingAverage3, linewidth=1, color=navy, transp=0)

alertcondition(signalBuy, title='Signal Buy', message='Signal Buy')
alertcondition(signalSell, title='Signal Sell', message='Signal Sell')


strategy.close("L", when=dcLower[1] > low)
strategy.close("S", when=dcUpper[1] < high)

strategy.entry("L", strategy.long, 1, when = signalBuy and testPeriod() and uptrend)
strategy.entry("S", strategy.short, 1, when = signalSell and testPeriod() and uptrend ==false)

//strategy.exit("Exit Long", from_entry = "L", loss = 25000000, profit=25000000)
//strategy.exit("Exit Short", from_entry = "S", loss = 25000000, profit=25000000)
More
- Momentum Trend Strategy
- Momentum Moving Average Crossover Quant Strategy
- Combination Strategy of Dual Moving Average Reversal and ATR Trailing Stop
- Leveraged Martingale Futures Trading Strategy
- Momentum Pullback Strategy
- Dual Candlestick Prediction Close Strategy
- CMO and WMA Based Dual Moving Average Trading Strategy
- Stochastic Supertrend Tracking Stop Loss Trading Strategy
- Dual Reversal Oscillating Band Trend Following Strategy
- Trend Following Strategy Based on DMI and RSI
- Trend-Following Strategy with 3 EMAs, DMI and MACD
- Dual Indicators Breakthrough Strategy
- Pete Wave Trading System Strategy
- Quantitative Strategy Based on Exponential Moving Average and Volume Weighting
- Origix Ashi Strategy Based on Smoothed Moving Average
- BlackBit Trader XO Macro Trend Scanner Strategy
- Crude Oil ADX Trend Following Strategy
- MT-Coordination Trading Strategy
- Combo Strategy of Double Factors Reversal and Improved Price Volume Trend
- Trend Angle Moving Average Crossover Strategy