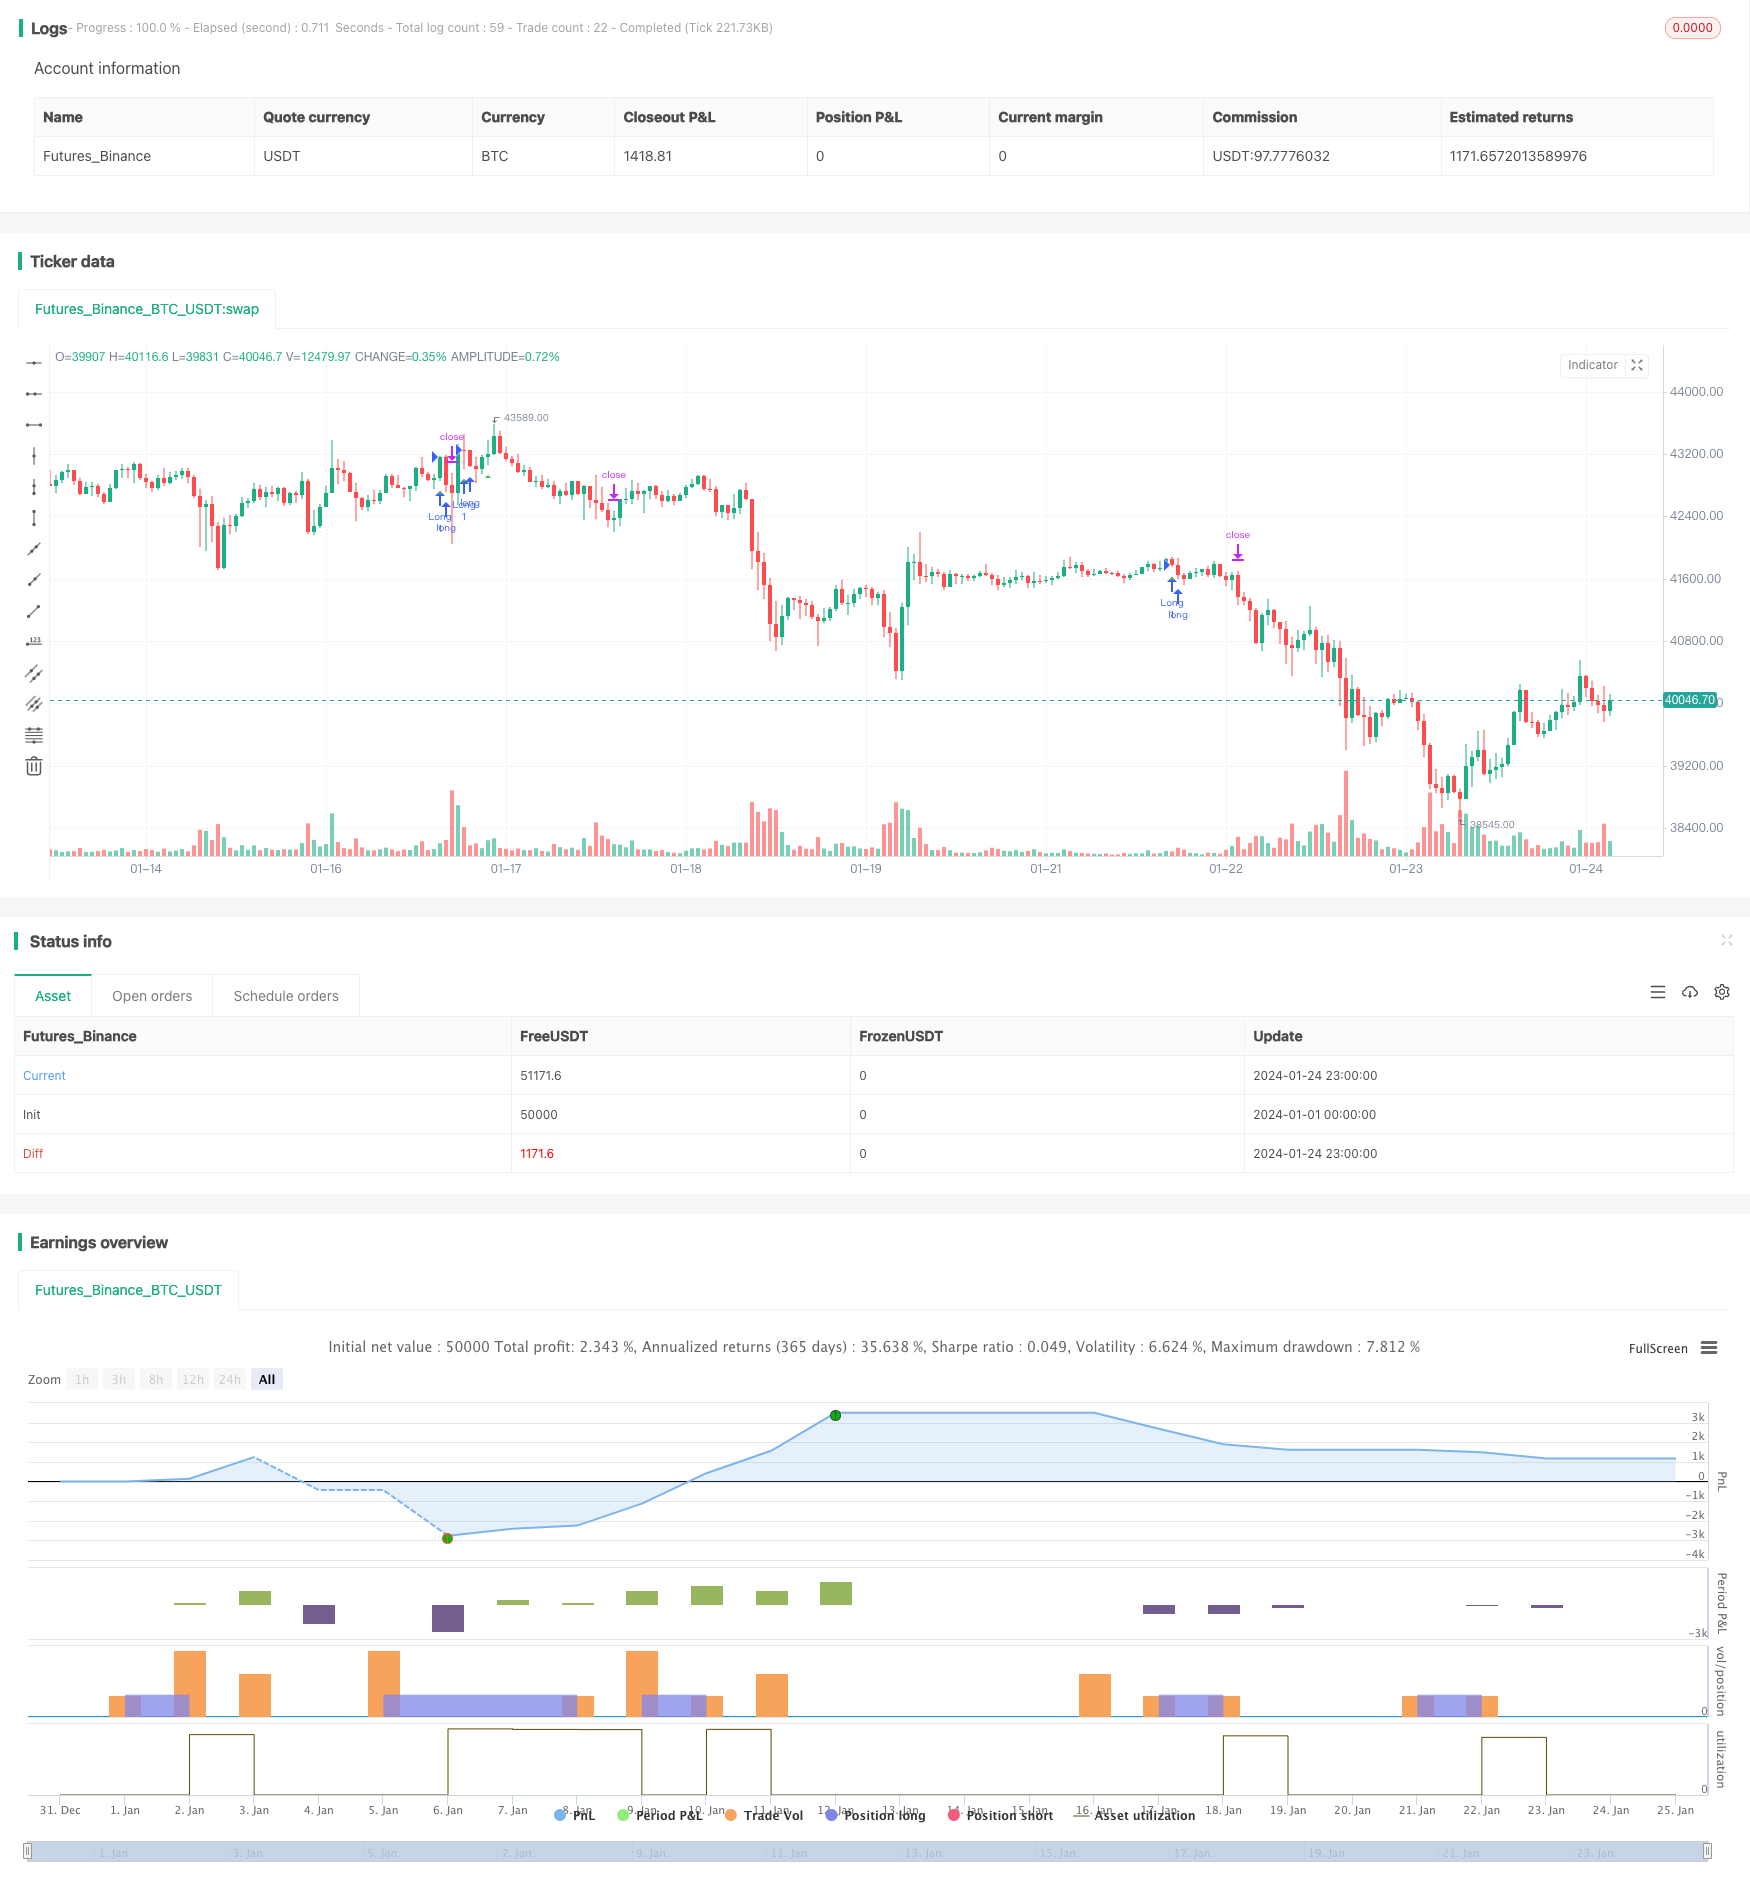
Three EMA Stochastic RSI Crossover Golden Cross Strategy
Author: ChaoZhang, Date: 2024-01-26 16:07:34Tags:

Overview
The Three EMA Stochastic RSI Crossover Golden Cross strategy is a trend following strategy. It combines the Three EMA indicator and the Stochastic Relative Strength Index to determine entry signals based on the crossover of the two indicators.
Strategy Logic
The signal determination of this strategy is based on the following logic:
Three EMA to determine the trend: 8-day EMA on top, 14-day EMA in the middle and 50-day EMA at the bottom form an uptrend; the reverse forms a downtrend.
Stochastic RSI to determine crossover: when the K line crosses above the D line from below, a golden cross signal is generated, indicating a strong uptrend.
Only go long; short is not considered for now.
When the Three EMA shows an uptrend and the Stochastic RSI generates a golden cross, go long. Set stop loss and take profit based on this to lock in profits.
Advantage Analysis
The main advantages of this strategy with dual indicator determination are:
Three EMA filters out short term noise and locks in medium-long term trends.
Stochastic RSI golden cross confirms strong uptrend.
ATR smart stop loss and take profit locks in profits.
Simple and clear strategy logic, easy to understand and implement.
Risk Analysis
The main risks of this strategy are:
Vulnerable to consolidation. Frequent open/close orders bring trading risk when Three EMA generates multiple crosses in sideways markets. This can be solved by optimizing EMA parameters or adding other filters.
No shorting opportunities. Only longs miss bottom rebound chances. Consider adding MACD to find shorts in downtrends.
Optimization Directions
The main optimization directions include:
Optimize EMA parameters to improve trend determination.
Add MACD etc to determine downtrends and increase short chances.
Add volatility indicators like ATR to improve stops and limits.
Incorporate volume to avoid false breakouts.
Utilize machine learning etc for parameter optimization.
Conclusion
In summary, the Three EMA Stochastic RSI Crossover strategy effectively filters out consolidation and locks in trends by combining dual indicator determination, making it a simple and practical trend following strategy. Further improvements on parameters, filters, technologies will lead to better strategy performance.
/*backtest
start: 2024-01-01 00:00:00
end: 2024-01-25 00:00:00
period: 1h
basePeriod: 15m
exchanges: [{"eid":"Futures_Binance","currency":"BTC_USDT"}]
*/

//@version=4

strategy(title="Stoch RSI Crossover Strat + EMA", shorttitle="Stoch RSI Cross + EMA Strat", overlay = true)

// Time Range
FromMonth=input(defval=1,title="FromMonth",minval=1,maxval=12)
FromDay=input(defval=1,title="FromDay",minval=1,maxval=31)
FromYear=input(defval=2020,title="FromYear",minval=2017)
ToMonth=input(defval=1,title="ToMonth",minval=1,maxval=12)
ToDay=input(defval=1,title="ToDay",minval=1,maxval=31)
ToYear=input(defval=9999,title="ToYear",minval=2017)
start=timestamp(FromYear,FromMonth,FromDay,00,00)
finish=timestamp(ToYear,ToMonth,ToDay,23,59)
window()=>true

// See if this bar's time happened on/after start date
afterStartDate = time >= start and time<=finish?true:false

//STOCH RSI
smoothK = input(3, minval=1)
smoothD = input(3, minval=1)
lengthRSI = input(14, minval=1)
lengthStoch = input(14, minval=1)
src = input(close, title="RSI Source")

rsi1 = rsi(src, lengthRSI)
k = sma(stoch(rsi1, rsi1, rsi1, lengthStoch), smoothK)
d = sma(k, smoothD)

//ATR
lengthATR = input(title="ATR Length", defval=14, minval=1)
atr = atr(lengthATR)

//MULTI EMA
emasrc = close,
len1 = input(8, minval=1, title="EMA 1")
len2 = input(14, minval=1, title="EMA 2")
len3 = input(50, minval=1, title="EMA 3")

ema1 = ema(emasrc, len1)
ema2 = ema(emasrc, len2)
ema3 = ema(emasrc, len3)

col1 = color.lime
col2 = color.blue
col3 = color.orange

//EMA Plots
//plot(ema1, title="EMA 1", linewidth=1, color=col1)
//plot(ema2, title="EMA 2", linewidth=1, color=col2)
//plot(ema3, title="EMA 3", linewidth=1, color=col3)

crossup = k[0] > d[0] and k[1] <= d[1]
emapos = ema1 > ema2 and ema2 > ema3 and close > ema1
barbuy = crossup and emapos

//plotshape(crossup, style=shape.triangleup, location=location.belowbar, color=color.white)
plotshape(barbuy, style=shape.triangleup, location=location.belowbar, color=color.green)

longloss = sma(open, 1)
//plot(longloss, color=color.red)

//Buy and Sell Factors
profitfactor = input(title="Profitfactor", type=input.float, step=0.1, defval=2)
stopfactor = input(title="Stopfactor", type=input.float, step=0.1, defval=3)
bought = strategy.position_size[1] < strategy.position_size
longcondition = barbuy

if (longcondition) and (afterStartDate) and strategy.opentrades < 1
    strategy.entry("Long", strategy.long)

if (afterStartDate) and strategy.opentrades > 0
    barsbought = barssince(bought)
    profit_level = strategy.position_avg_price + (atr*profitfactor)
    stop_level = strategy.position_avg_price - (atr*stopfactor)
    strategy.exit("Take Profit/ Stop Loss", "Long", stop=stop_level[barsbought], limit=profit_level[barsbought])
- Trend Following Strategy Based on Dynamic Stop Loss of Dual EMA Crossover
- Bull Market Breakout Darvas Box Buy Strategy
- The relative momentum strategy
- Wave Trend and VWMA Based Trend Following Quant Strategy
- Dual Moving Average and Williams Average Combination Strategy
- Adaptive Triple Supertrend Strategy
- Moving Average Crossover Strategy
- Multiple Indicator Quantitative Trading Strategy
- Market Cypher Wave B Automated Trading Strategy
- Key Reversal Backtest Strategy
- Reversal Candlestick Backtesting Strategy
- Ehlers-Smoothed Stochastic RSI Strategy
- Swing High Low Price Channel Strategy V.1
- Momentum Reversal Trading Strategy
- Adaptive Linear Regression Channel Strategy
- Moving Average Difference Zero Cross Strategy
- Multiple Indicators Follow Strategy
- Solid Trend Following Strategy
- Price Crossing Moving Average Trend Following Strategy
- Dual EMA Golden Cross Breakout Strategy