Cross-Border Short-Term Breakthrough Reversal 5EMA Strategy
Author: ChaoZhang, Date: 2024-01-30 15:30:19Tags:

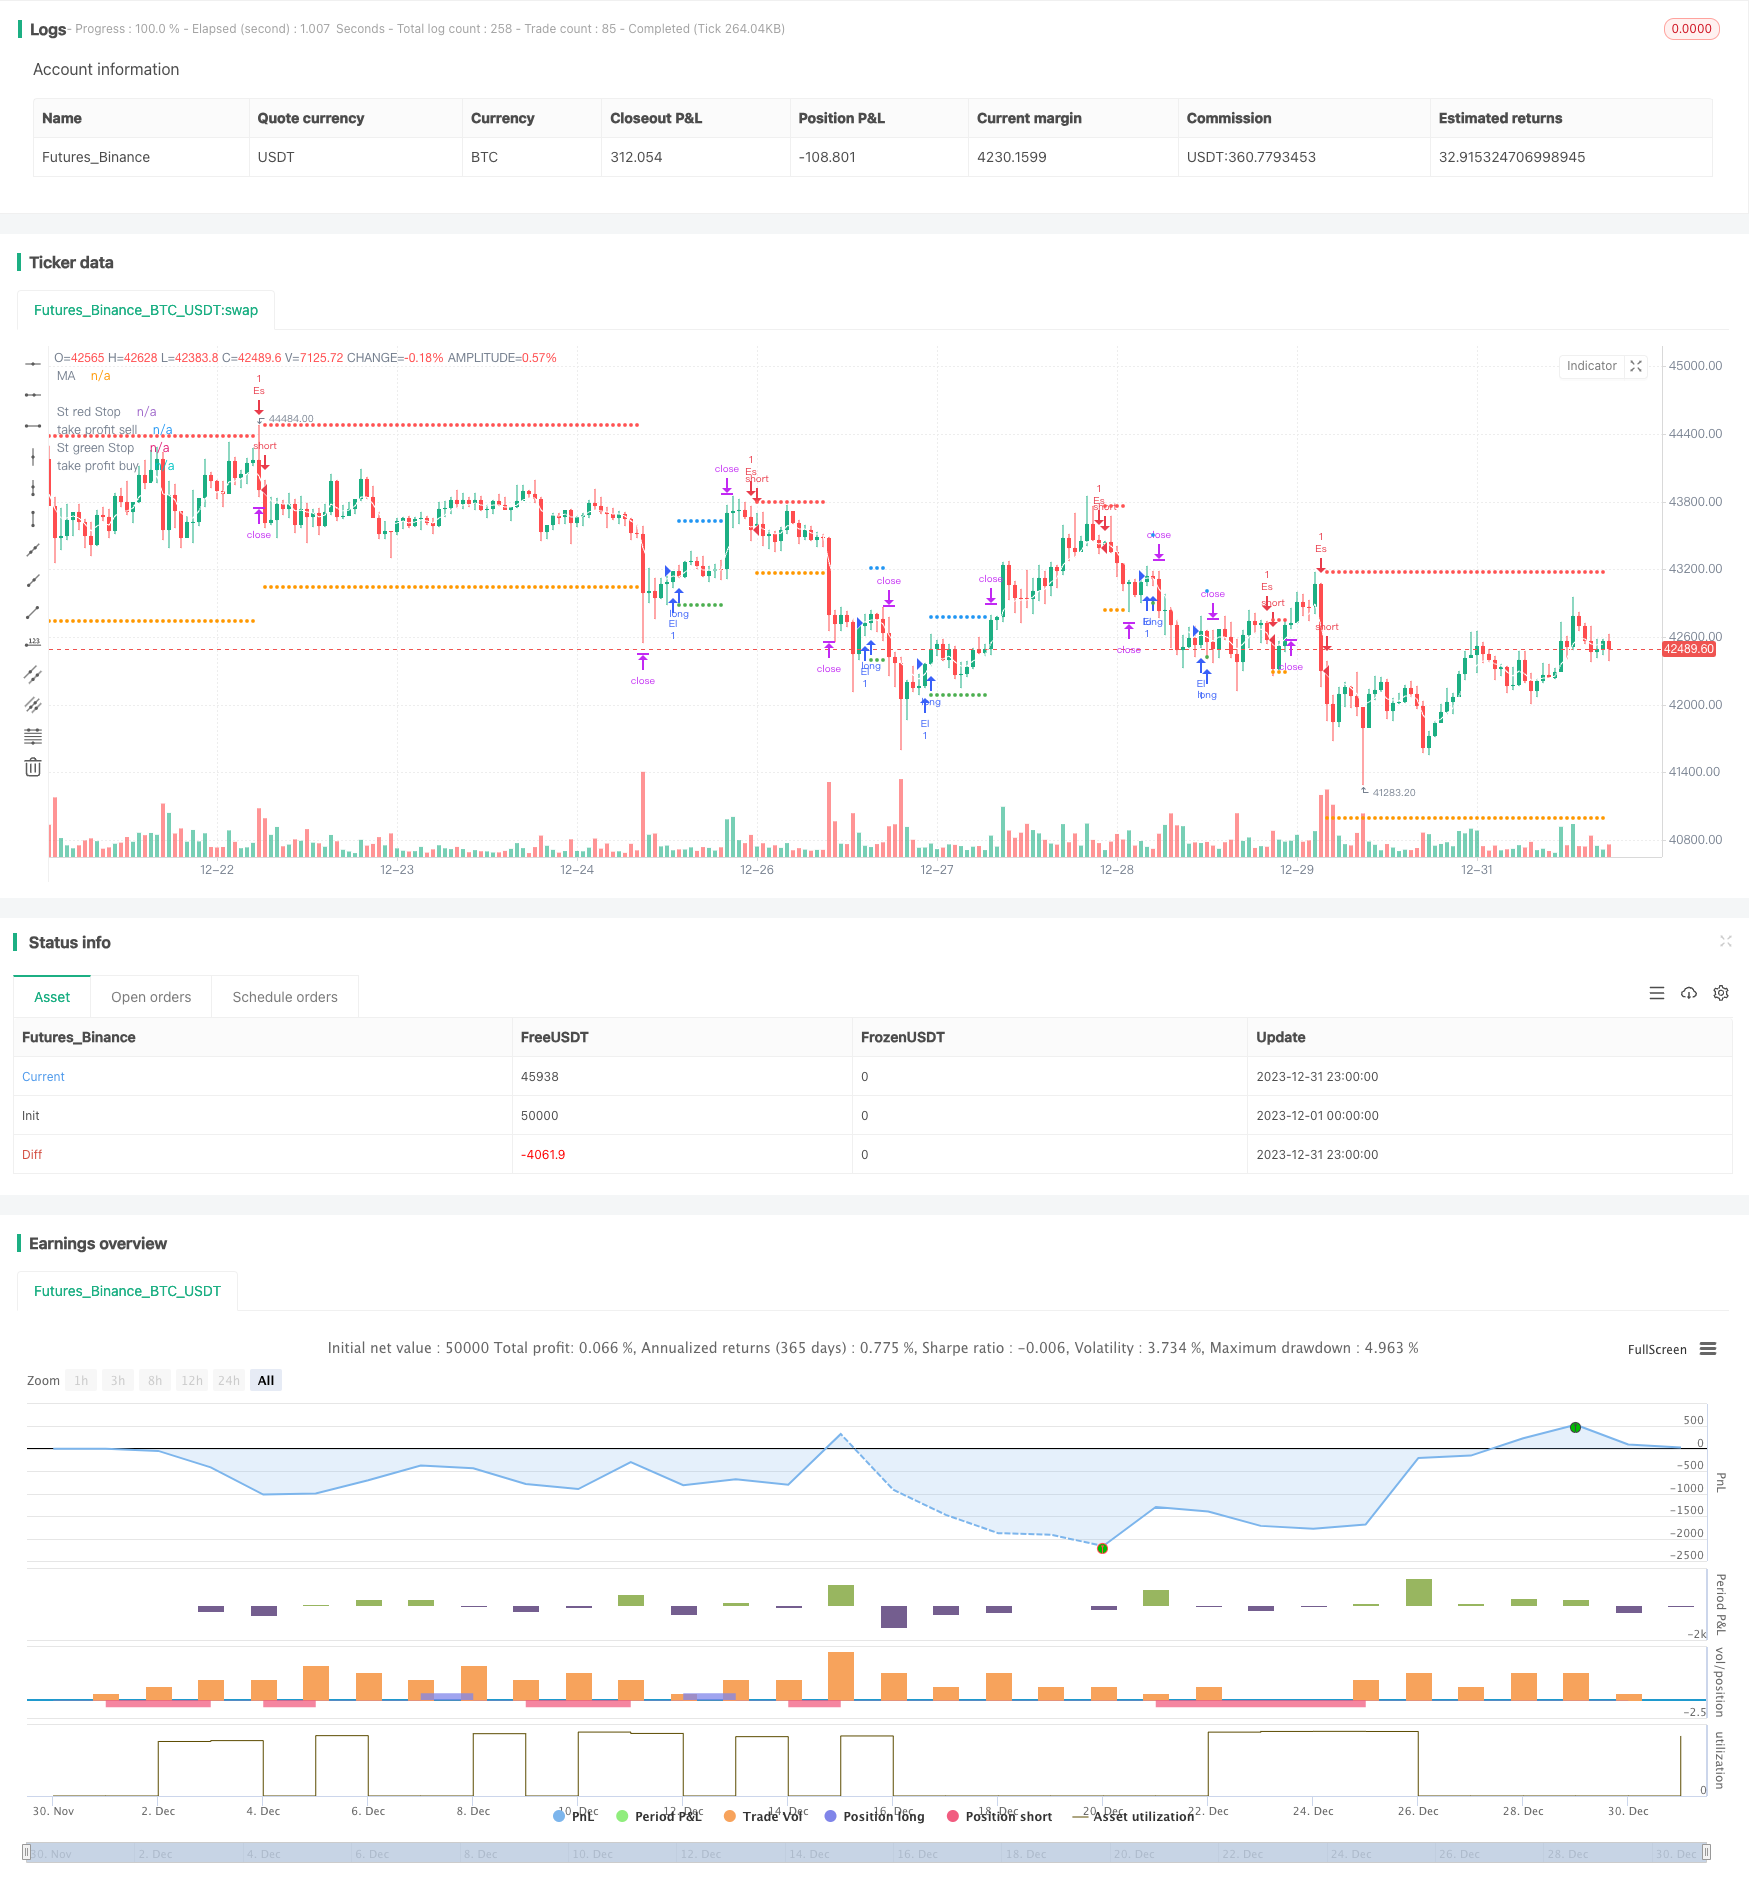
This article will introduce a short-term reversal trading strategy based on the 5EMA indicator. The strategy mainly uses the 5EMA indicator to judge the price trend and reverse trades when the price breaks through the EMA.
Strategy Overview
This is a short-term quantitative strategy, mainly used for high-frequency trading. The strategy will simultaneously judge bullish and bearish signals and can trade in both directions. Trading signals are generated when prices break through the 5EMA indicator, and long or short positions are entered according to the direction of the breakthrough.
The advantage of the strategy is to capture short-term price reversal opportunities and quickly enter the market. The main risk comes from losses caused by false breakouts. Risk can be reduced by optimizing parameters.
Strategy Principle
Use 5-period EMA indicator to determine short-term price trend
Judge whether the price breaks through the EMA indicator
When the price breaks through the EMA from top to bottom, a sell signal is generated.
When the price breaks through the EMA from bottom to top, a buy signal is generated.
Set stop loss and take profit to limit single loss
Since the EMA indicator can effectively determine short-term trends, it can quickly capture trading opportunities when prices show significant reversals. The 5EMA parameter is relatively flexible and responds quickly to the market, making it suitable for high-frequency trading.
Advantages of the Strategy
- Fast response, suitable for high-frequency capturing of short-term trading opportunities
- Two-way trading, can be long and short at the same time
- Reasonable stop loss and take profit settings, single loss limited
- Simple parameter settings, easy to optimize strategies
Risks and Solutions of Strategies
- Unnecessary losses caused by false breakout risks
- Optimize EMA cycle parameters to ensure indicator stability
- Excessive trading frequency can easily chase highs and kill lows
- Limit maximum number of trades per day
Optimization Direction of Strategies
- Optimize EMA indicator parameters to find the best cycle portfolio
- Increase filter to reduce false breakout probability
- Limit maximum number of trades per day
- Combine other indicators to determine trend direction
Summary
In general, this is a very practical short-term breakout strategy. Using EMA indicators to determine price reversals is very simple and effective, and an important tool for quantitative trading. Through parameter optimization and risk control settings, the win rate of strategies can be greatly improved, which is highly recommended.
/*backtest
start: 2023-12-01 00:00:00
end: 2023-12-31 23:59:59
period: 1h
basePeriod: 15m
exchanges: [{"eid":"Futures_Binance","currency":"BTC_USDT"}]
*/

// This Pine Script™ code is subject to the terms of the Mozilla Public License 2.0 at https://mozilla.org/MPL/2.0/
// © samscripter

//@version=5
strategy("5 ema strategy",overlay = true,process_orders_on_close = true)

// Choose trade direction

t_dir = input.string("Both", title="Trade Direction",options=["Long", "Short", "Both"],group = 'Trade Direction Set')

long_side  = t_dir == "Long" or t_dir == "Both"
short_side = t_dir == "Short" or t_dir == "Both"

// number of trade
mx_num =input.int(4,title = 'number Of trade',group = 'Maximum Number Of Trade')
var hi =0.0
var lo =0.0

var group_ma1="Ema Set"

//Ema 1
on_ma=input.bool(true,"Enable EMa 1 Plot On/Off"  ,group =group_ma1)
ma_len= input.int(5, minval=1, title="Ema Length",group =group_ma1)
ma_src = input.source(close, title="Ema Source"   ,group = group_ma1)
ma_out = ta.ema(ma_src, ma_len)

// buy and sell ema condition
plot(on_ma?ma_out:na, color=color.white, title="MA")


if close>ma_out and open>ma_out and low>ma_out and high>ma_out
    lo:=low

if close<ma_out and open<ma_out and low<ma_out and high<ma_out
    hi:=high

// condition when price is crossunder lo take sell and when price crossoing hi take buy
var buyp_sl =float(na)
var sellp_sl =float(na)

//count number trade since day stra
var count_buysell=0

if  close>hi[1]
    if strategy.position_size==0 and count_buysell<mx_num and long_side
        strategy.entry('El',strategy.long,comment = 'Long')
        count_buysell:=count_buysell+1
        buyp_sl:=math.min(low,low[1])
    hi:=na
if  close<lo[1]
    if strategy.position_size==0 and count_buysell<mx_num and short_side
        strategy.entry('Es',strategy.short,comment = 'short')
        count_buysell:=count_buysell+1
        sellp_sl:=math.max(high,high[1])
    lo:=na

//take profit multiply

tpnew = input.float(title="take profit", step=0.1, defval=1.5, group='Tp/SL')


//stop loss previous candle high and previous candle low
buy_sl = ta.valuewhen(strategy.position_size != 0 and strategy.position_size[1] == 0,buyp_sl , 0)
sell_sl= ta.valuewhen(strategy.position_size != 0 and strategy.position_size[1] == 0,sellp_sl, 0)

//take profit
takeProfit_buy = strategy.position_avg_price - ((buy_sl - strategy.position_avg_price) *tpnew)
takeProfit_sell = strategy.position_avg_price - ((sell_sl - strategy.position_avg_price) *tpnew)


//  Submit exit orders
if strategy.position_size > 0
    strategy.exit(id='XL', stop=buy_sl,limit=takeProfit_buy,comment_loss = 'Long Sl',comment_profit = 'Long Tp')

if strategy.position_size < 0
    strategy.exit(id='XS', stop=sell_sl,limit=takeProfit_sell,comment_loss = 'Short Sl',comment_profit = 'Short Tp')

//plot data
plot(series=strategy.position_size < 0 ?sell_sl : na, style=plot.style_circles, color=color.red, linewidth=2, title="St red Stop")
plot(series=strategy.position_size > 0 ?buy_sl  : na, style=plot.style_circles, color=color.green, linewidth=2, title="St green Stop")


// plot take profit
plot(series=strategy.position_size < 0 ? takeProfit_sell : na, style=plot.style_circles, color=color.orange, linewidth=2, title="take profit sell")
plot(series=strategy.position_size > 0 ? takeProfit_buy: na, style=plot.style_circles, color=color.blue, linewidth=2, title="take profit buy")

if ta.change(time('D'))
    count_buysell:=0
- Bollinger Band Moving Average Crossover Strategy
- Scalping Dips in Bull Market Strategy
- Trend Following Strategy Based on Adaptive Moving Average
- True Relative Movement Moving Average Strategy
- MACD and RSI Based 5-Minute Momentum Trading Strategy
- Double Fractal Breakout Strategy
- Noro Shifted Moving Average Stop Loss Strategy
- Double Exponential Moving Average RSI Trading Strategy
- Simple Moving Average Crossover Strategy
- Scalping Strategy Based on Market Liquidity and Trend
- RSI Indicator Based Stock Trading Pyramiding Strategy
- All about EMA Channel Trading Strategy
- Double Decker RSI Trading Strategy
- Bollinger Bands and RSI Combination Strategy
- Double Inside Bar & Trend Strategy
- Amazing Price Breakout Strategy
- Robust Trend Continuation Strategy
- Trend Tracking Moving Average Crossover Strategy
- Breakout Reversal Model Based on Turtle Trading Strategy
- Momentum Trend Strategy