Dual Channel Breakout Strategy
Author: ChaoZhang, Date: 2024-02-01 14:43:07Tags:

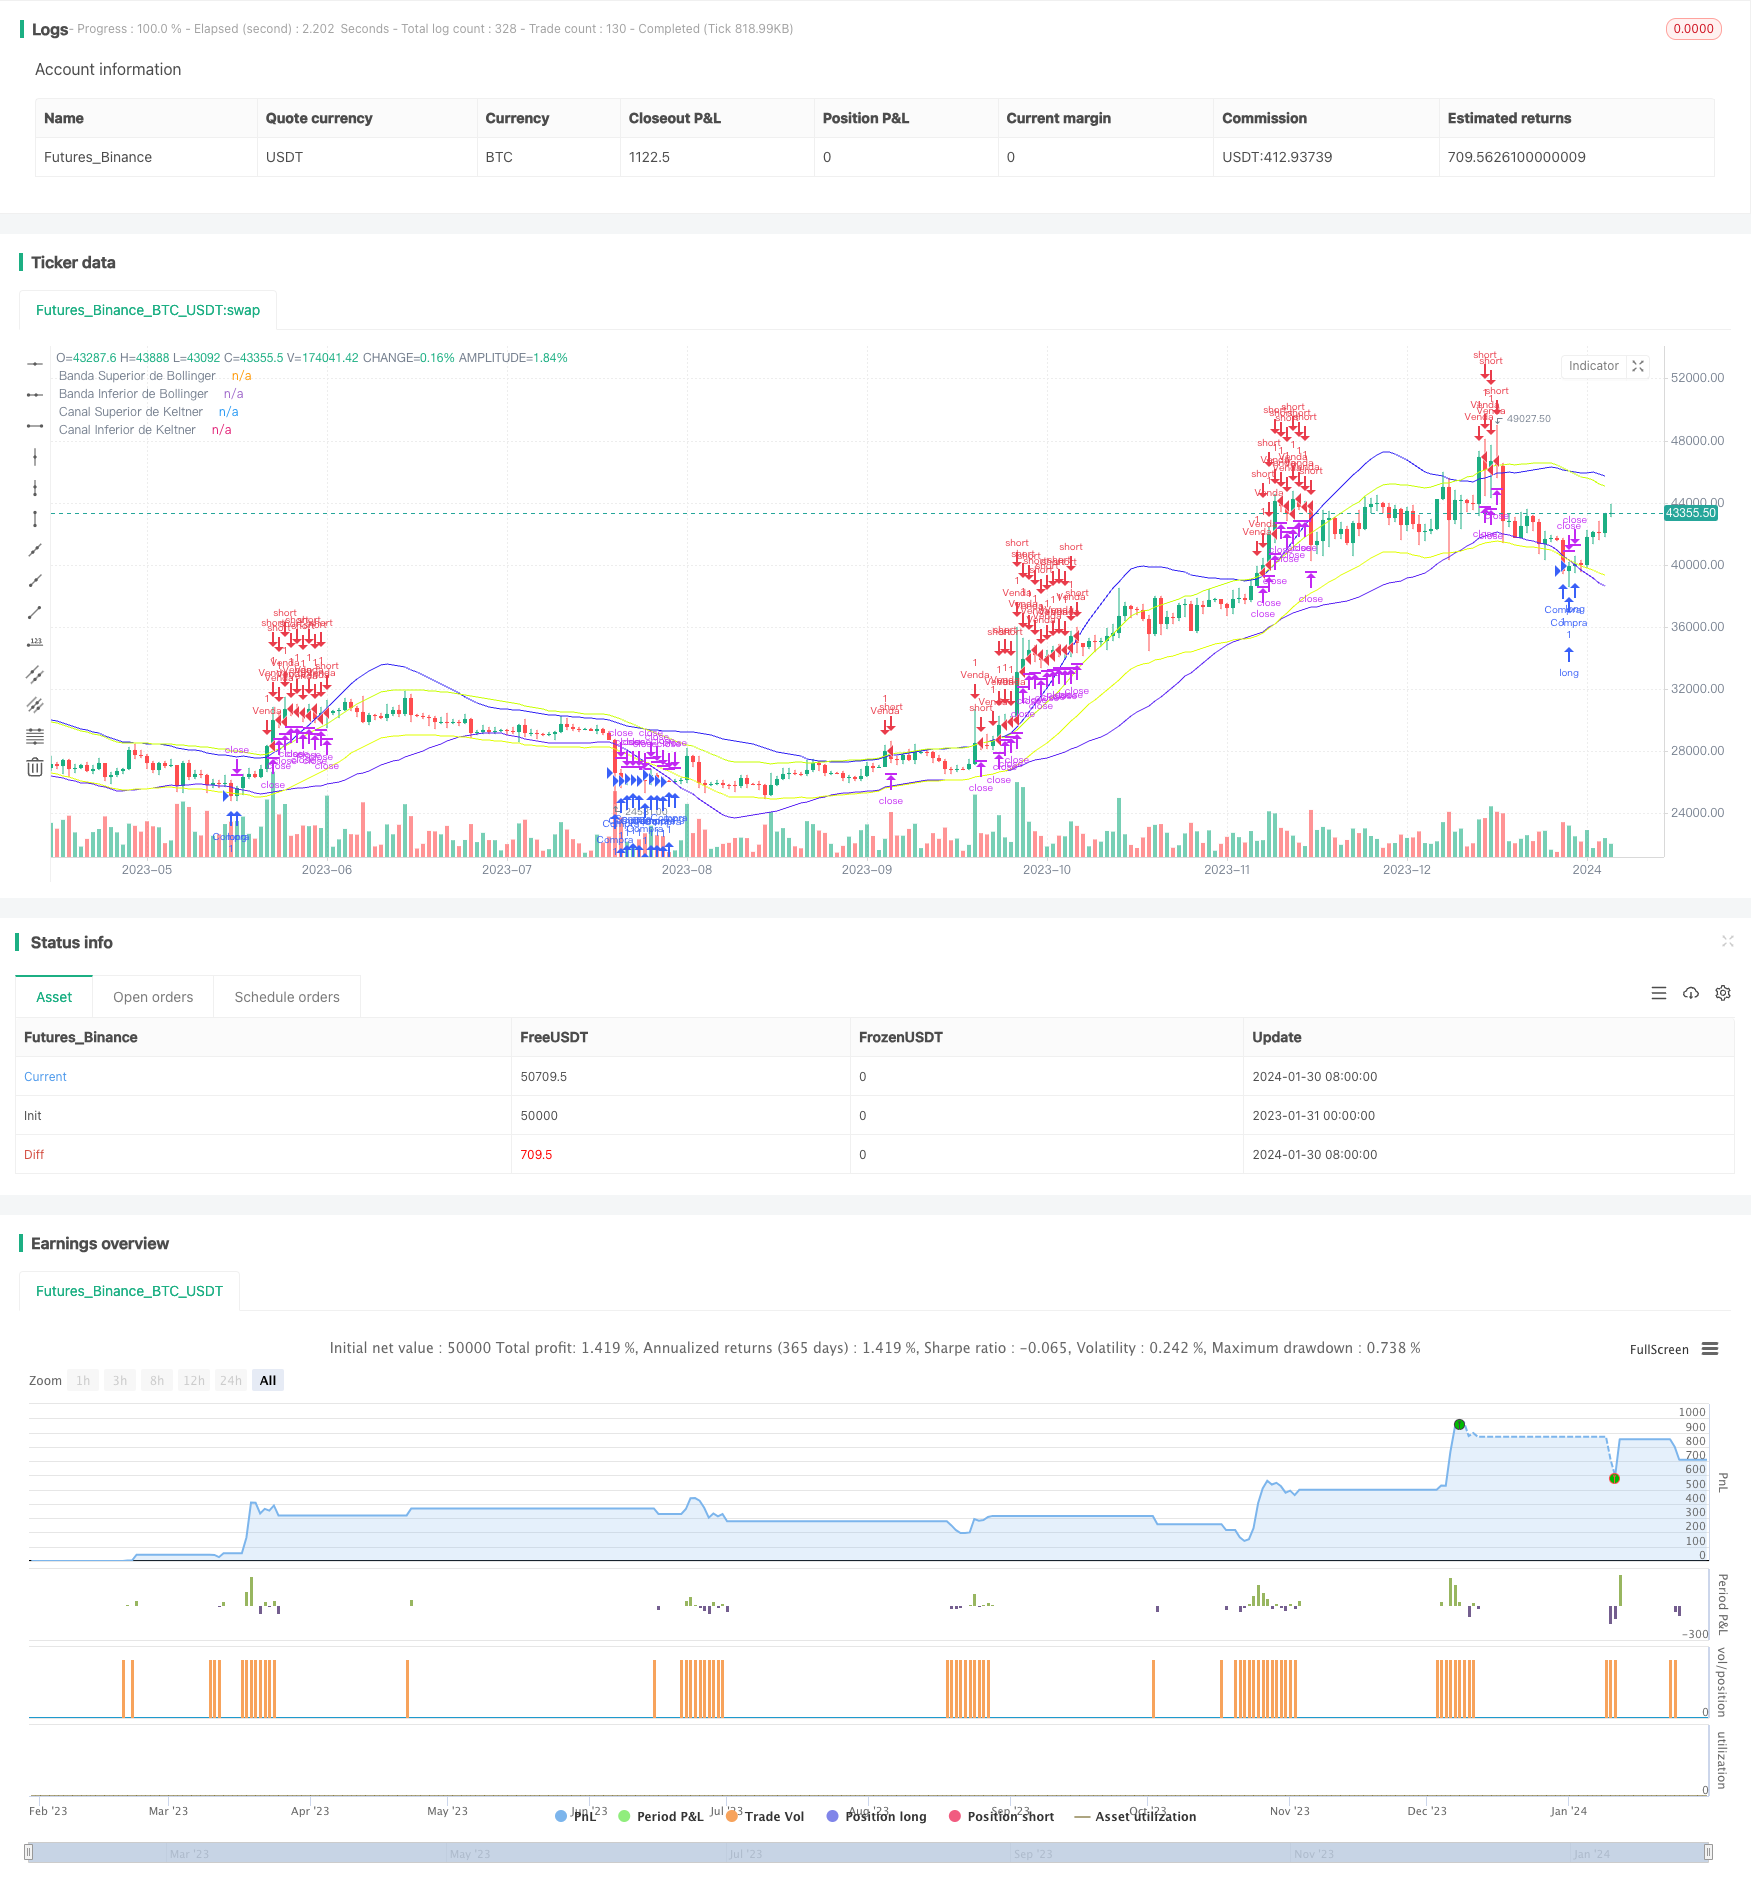
The strategy is named after its use of two indicators, Bollinger Bands and Keltner Channels, to generate trading signals. It monitors price breakouts beyond channel boundaries, going long on downside breakouts and short on upside breakouts.
Strategy Logic
The strategy combines Bollinger Bands and Keltner Channels. Bollinger Bands are adaptive channels plotted at a moving average line plus/minus standard deviations. Keltner Channels use true range to compute channel width.
The trading logic is to go long when the closing price falls below the lower Bollinger Band and lower Keltner Channel, anticipating a reversal. It goes short when the closing price rises above the upper Bollinger and Keltner Channel boundaries. Stops and take profits are set after entry.
Strengths
By combining two channels, the strategy effectively identifies abnormal price swings. The dual channel filters help avoid false signals. The stops and take profits also aid in risk control.
Compared to using just Bollinger Bands or Keltner Channels, this strategy filters out more noise for higher-quality signals. Dual-channel breakouts allow timely entries aiming to capture reversals.
Risk Analysis
A key risk is the lagging nature of channel indicators. Prices could start reversing before hitting the channel boundaries that trigger signals. This may result in late entries or being caught in pullbacks.
Overly tight stops and excessively wide take profits are other risks. These need to be adjusted per market conditions.
Enhancement Opportunities
The strategy can be optimized by adding auxiliary filters like momentum oscillators. Parameter tuning to discover optimal combinations may also help.
Incorporating adaptive stops and take profits is another enhancement route, helping the strategy better adapt to evolving markets.
Conclusion
This dual channel breakout strategy combines the strengths of Bollinger Bands and Keltner Channels to effectively identify reversal opportunities, while controlling risks via dual channel filters and stop/take profit settings. It is a quality, risk-managed quantitative trading strategy.
/*backtest
start: 2023-01-31 00:00:00
end: 2024-01-31 00:00:00
period: 1d
basePeriod: 1h
exchanges: [{"eid":"Futures_Binance","currency":"BTC_USDT"}]
*/

//@version=4
strategy("Estratégia de Compra/Venda BB e KC", overlay=true)

// Parâmetros das Bandas de Bollinger
bollinger_length = input(20, title="Comprimento das Bandas de Bollinger", minval=1)
bollinger_deviation = input(2.0, title="Desvio Padrão das Bandas de Bollinger", minval=0.1)

// Parâmetros dos Canais de Keltner
keltner_length = input(20, title="Comprimento dos Canais de Keltner", minval=1)
atr_multiplier = input(1.5, title="Multiplicador ATR dos Canais de Keltner", minval=0.1)

// Take Profit e Stop Loss em termos financeiros
take_profit = input(10.0, title="Take Profit (em $)", step=1)
stop_loss = input(20.0, title="Stop Loss (em $)", step=1)

// Cálculos das Bandas de Bollinger
basis_bb = sma(close, bollinger_length)
dev_bb = sma(stdev(close, bollinger_length), bollinger_length)
upper_bb = basis_bb + dev_bb * bollinger_deviation
lower_bb = basis_bb - dev_bb * bollinger_deviation

// Cálculos dos Canais de Keltner
basis_kc = sma(close, keltner_length)
atr_kc = sma(atr(keltner_length), keltner_length)
upper_kc = basis_kc + atr_multiplier * atr_kc
lower_kc = basis_kc - atr_multiplier * atr_kc

// Condição de Compra
buy_condition = close < lower_bb and close < lower_kc

// Condição de Venda
sell_condition = close > upper_bb and close > upper_kc

// Estratégia de Compra/Venda com TP e SL
if (buy_condition)
    strategy.entry("Compra", strategy.long)
    strategy.exit("Take Profit/Stop Loss", from_entry="Compra", profit=take_profit, loss=stop_loss)
if (sell_condition)
    strategy.entry("Venda", strategy.short)
    strategy.exit("Take Profit/Stop Loss", from_entry="Venda", profit=take_profit, loss=stop_loss)

// Plot das Bandas de Bollinger e dos Canais de Keltner
plot(upper_bb, color=color.rgb(47, 33, 243), title="Banda Superior de Bollinger")
plot(lower_bb, color=color.rgb(89, 33, 243), title="Banda Inferior de Bollinger")
plot(upper_kc, color=color.rgb(200, 255, 0), title="Canal Superior de Keltner")
plot(lower_kc, color=color.rgb(225, 255, 0), title="Canal Inferior de Keltner")
- Ergotic Momentum Direction Convergence Trading Strategy
- Moving Average and Stochastic Trading Strategy
- An Optimization of Dual Moving Average Trend Following Strategy Based on Indicators Combination
- The Efficient Quant Trading Strategy Combining
- Dual Moving Average Crossover and Williams Indicator Combo Strategy
- Momentum Breakthrough Silver Line Strategy
- RWI Volatility Contrarian Strategy
- Parabolic SAR Trend Tracking Stop Loss Reversal Strategy
- Momentum Indicator Crossover Strategy
- Efficient Oscillation Breakthrough Dual Stop Profit and Stop Loss Strategy
- Grid Trading Strategy Based on Real-time K-line Tracking
- Breakout Pullback Strategy
- Multi-cycle Adaptive Trend Forecast Strategy
- Renko ATR Trend Reversal Strategy
- Ichimoku Clouds Quant Strategy
- Dual-directional Trend Tracking Strategy Based on Range Breakout
- Cryptocurrency Trading Strategy Based on MACD and Stochastic Indicators
- Swing Dual Moving Average and RSI Crossover Strategy
- Golden Bollinger Band Gap Reversion System
- Quantitative Trend Tracking Strategy