Triple Exponential Moving Average Profit Taking and Stop Loss Strategy
Author: ChaoZhang, Date: 2024-02-04 10:38:42Tags:

Overview
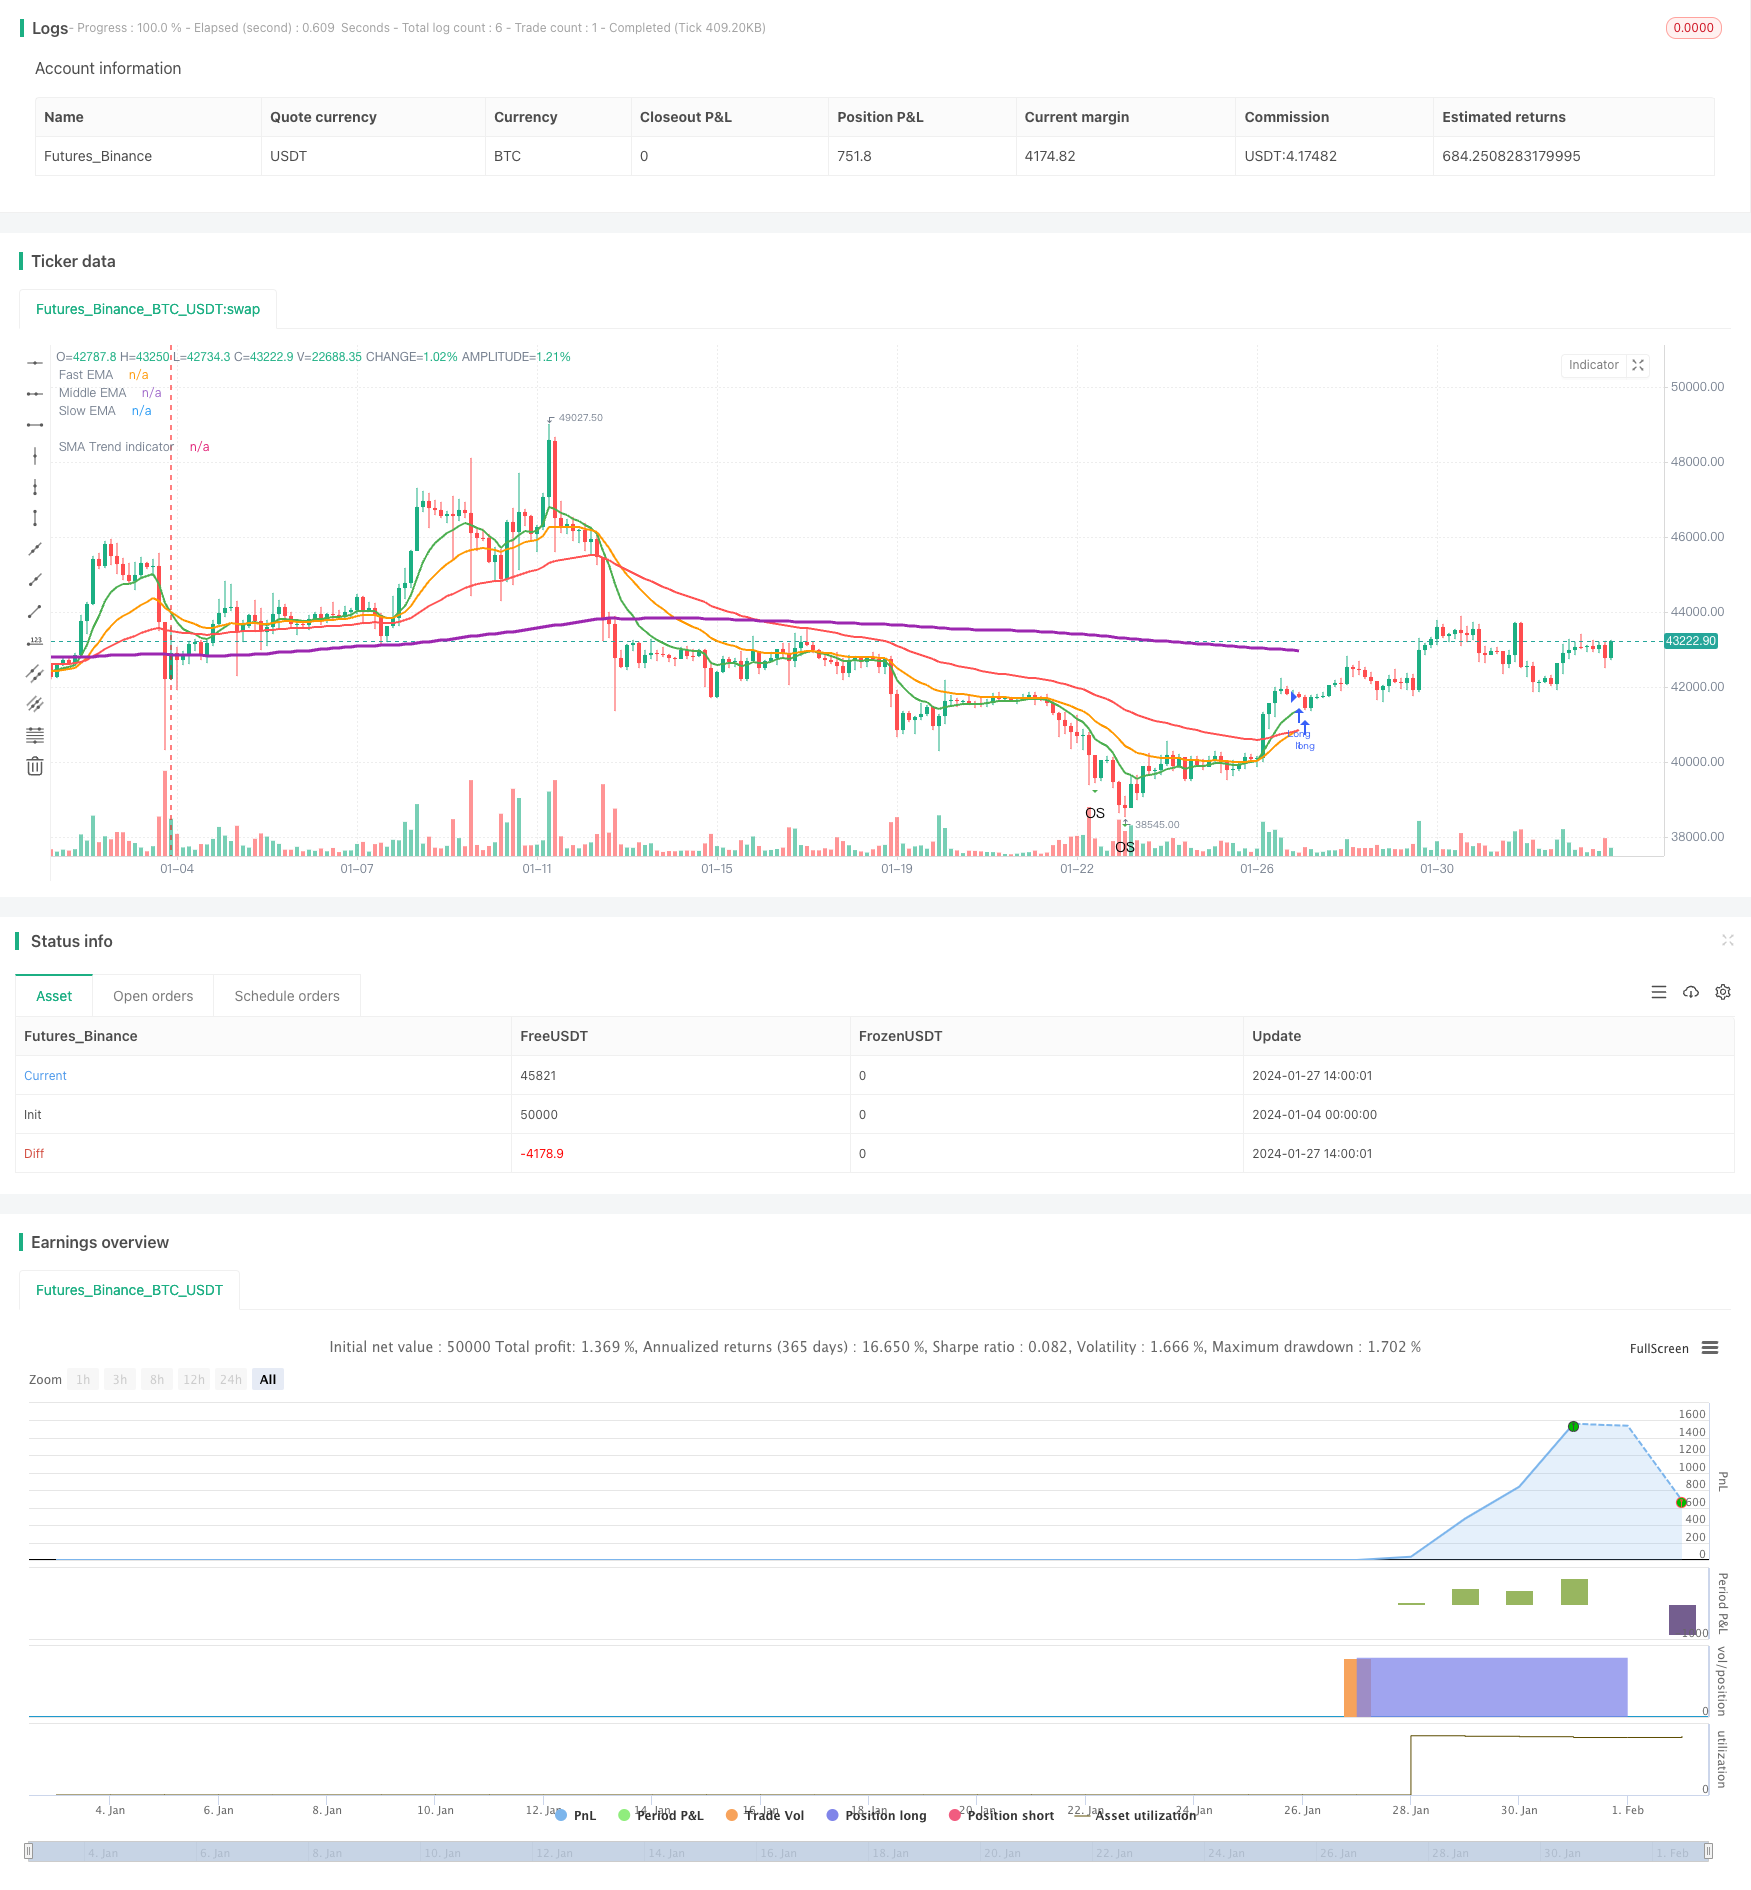
The Triple Exponential Moving Average Profit Taking and Stop Loss Strategy is a trend-following strategy based on three exponential moving averages with different periods for market entry and exit. It also uses the Average True Range indicator to set profit-taking and stop-loss levels for risk management.
Strategy Logic
The strategy uses three exponential moving averages: fast line, middle line, and slow line. It goes long when the middle line crosses above the slow line, and closes position when the fast line crosses below the middle line. This is a typical trend-following strategy that determines trend directionality through the crossing of the three moving averages.
At the same time, the strategy leverages the Average True Range indicator to calculate profit-taking and stop-loss levels. Specifically, the take profit for long positions is entry price + Average True Range * profit factor, and for short positions it is entry price - Average True Range * profit factor. The stop loss logic is similar. This effectively limits the risk of large losses.
Advantage Analysis
- Decision indicators are intuitive and easy to understand.
- Systematic and easy to automate.
- Balances trend-following and risk control.
Risk Analysis
- There is some lag and inability to timely capture reversals.
- Prone to stop loss in ranging markets.
- Parameter tuning needs optimization, otherwise results may be poor.
Risk mitigation measures include: shortening moving average periods, optimizing profit/stop factor, and adding auxiliary indicators.
Optimization Directions
- Test combinations of moving averages to find optimal parameters.
- Add other technical indicators like MACD, RSI etc.
- Use machine learning to auto optimize parameters.
- Dynamically adjust profit/stop level based on true range.
- Incorporate sentiment to avoid overcrowding.
Conclusion
Overall this is an effective trend-following strategy with stable performance and easy implementation via simple parameters. The dynamic profit taking and stop loss based on Average True Range limits per-side risk. But parameter optimization and indicator combinations need to be done carefully to prevent overfitting or decision lag. On balance, this strategy has good risk-reward profile and is worth considering.
/*backtest
start: 2024-01-04 00:00:00
end: 2024-02-03 00:00:00
period: 3h
basePeriod: 15m
exchanges: [{"eid":"Futures_Binance","currency":"BTC_USDT"}]
*/

//@version=4
//© Densz
strategy("3EMA with TP & SL (ATR)", overlay=true )

// INPUTS
startTime           =       input(title="Start Time", type = input.time, defval = timestamp("01 Jan 2017 00:00 +0000"))
endTime             =       input(title="End Time", type = input.time, defval = timestamp("01 Jan 2022 00:00 +0000"))

slowEMALength       =       input(title="Slow EMA Length", type = input.integer, defval = 55)
middleEMALength     =       input(title="Middle EMA Length", type = input.integer, defval = 21)
fastEMALength       =       input(title="Fast EMA Length", type = input.integer, defval = 9)

trendMALength       =       input(title="Trend indicator MA Length", type = input.integer, defval = 200)

atrLength           =       input(title="ATR Length", type = input.integer, defval = 14)
tpATRMult           =       input(title="Take profit ATR multiplier", type = input.integer, defval = 3)
slATRMult           =       input(title="Stop loss ATR multiplier", type = input.integer, defval = 2)

rsiLength           =       input(title="RSI Length", type = input.integer, defval = 14)

// Indicators
slowEMA             =       ema(close, slowEMALength)
middEMA             =       ema(close, middleEMALength)
fastEMA             =       ema(close, fastEMALength)
atr                 =       atr(atrLength)

rsiValue            =       rsi(close, rsiLength)
isRsiOB             =       rsiValue >= 80
isRsiOS             =       rsiValue <= 20

sma200              =       sma(close, trendMALength)

inDateRange         =       true

// Plotting
plot(slowEMA, title="Slow EMA", color=color.red, linewidth=2, transp=50)
plot(middEMA, title="Middle EMA", color=color.orange, linewidth=2, transp=50)
plot(fastEMA, title="Fast EMA", color=color.green, linewidth=2, transp=50)

plot(sma200, title="SMA Trend indicator", color=color.purple, linewidth=3, transp=10)
plotshape(isRsiOB, title="Overbought", location=location.abovebar, color=color.red, transp=0, style=shape.triangledown, text="OB")
plotshape(isRsiOS, title="Oversold", location=location.belowbar, color=color.green, transp=0, style=shape.triangledown, text="OS")

float takeprofit    =       na
float stoploss      =       na

var line tpline     =       na
var line slline     =       na

if strategy.position_size != 0
    takeprofit := takeprofit[1]
    stoploss := stoploss[1]
    line.set_x2(tpline, bar_index)
    line.set_x2(slline, bar_index)
    line.set_extend(tpline, extend.none)
    line.set_extend(slline, extend.none)

// STRATEGY
goLong  = crossover(middEMA, slowEMA) and inDateRange
closeLong = crossunder(fastEMA, middEMA) and inDateRange


if goLong
    takeprofit := close + atr * tpATRMult
    stoploss := close - atr * slATRMult
    // tpline := line.new(bar_index, takeprofit, bar_index, takeprofit, color=color.green, width=2, extend=extend.right, style=line.style_dotted)
    // slline := line.new(bar_index, stoploss, bar_index, stoploss, color=color.red, width=2, extend=extend.right, style=line.style_dotted)
    // label.new(bar_index, takeprofit, "TP", style=label.style_labeldown)
    // label.new(bar_index, stoploss, "SL", style=label.style_labelup)
    strategy.entry("Long", strategy.long, when = goLong)
    strategy.exit("TP/SL", "Long", stop=stoploss, limit=takeprofit)
if closeLong
    takeprofit := na
    stoploss := na
    strategy.close(id = "Long", when = closeLong)

if (not inDateRange)
    strategy.close_all()
- SMA Crossover Bullish Trend Following Strategy
- Bollinger Bands Breakout Quantitative Trading Strategy
- Trend Following Strategy Based on Multi-Period SMA
- Market Sentiment-Based Ichimoku Breakout Strategy
- Dynamic Multi-indicator Quantitative Trading Strategy
- Coral Trend Pullback Strategy
- Swing Trading Strategy Based on Momentum
- Momentum Breakout Trading Strategy
- Trend Riding RSI Swing Capture Strategy
- Dual-Rail Parabolic SAR Bollinger Bands Strategy
- Donchian Channel Width Trading Strategy
- Optimized Moving Average Crossover Strategy
- Isolation Band Oscillation Tracking Strategy
- Double Donchian Channel Breakout Strategy
- CRSI Moving Average Strategy
- Self-adaptive Quant Grid Trading Strategy
- Multi-Timeframe Ichimoku, MACD and DMI Combined Strategy
- Price Divergence Based Trend Trading Strategy
- Supertrend Bitcoin Long Line Strategy
- Trend Following Strategy with Moving Average and Candlestick Patterns