Powerful EMA and RSI Quantitative Trading Strategy
Author: ChaoZhang, Date: 2024-02-04 15:12:20Tags:

Overview
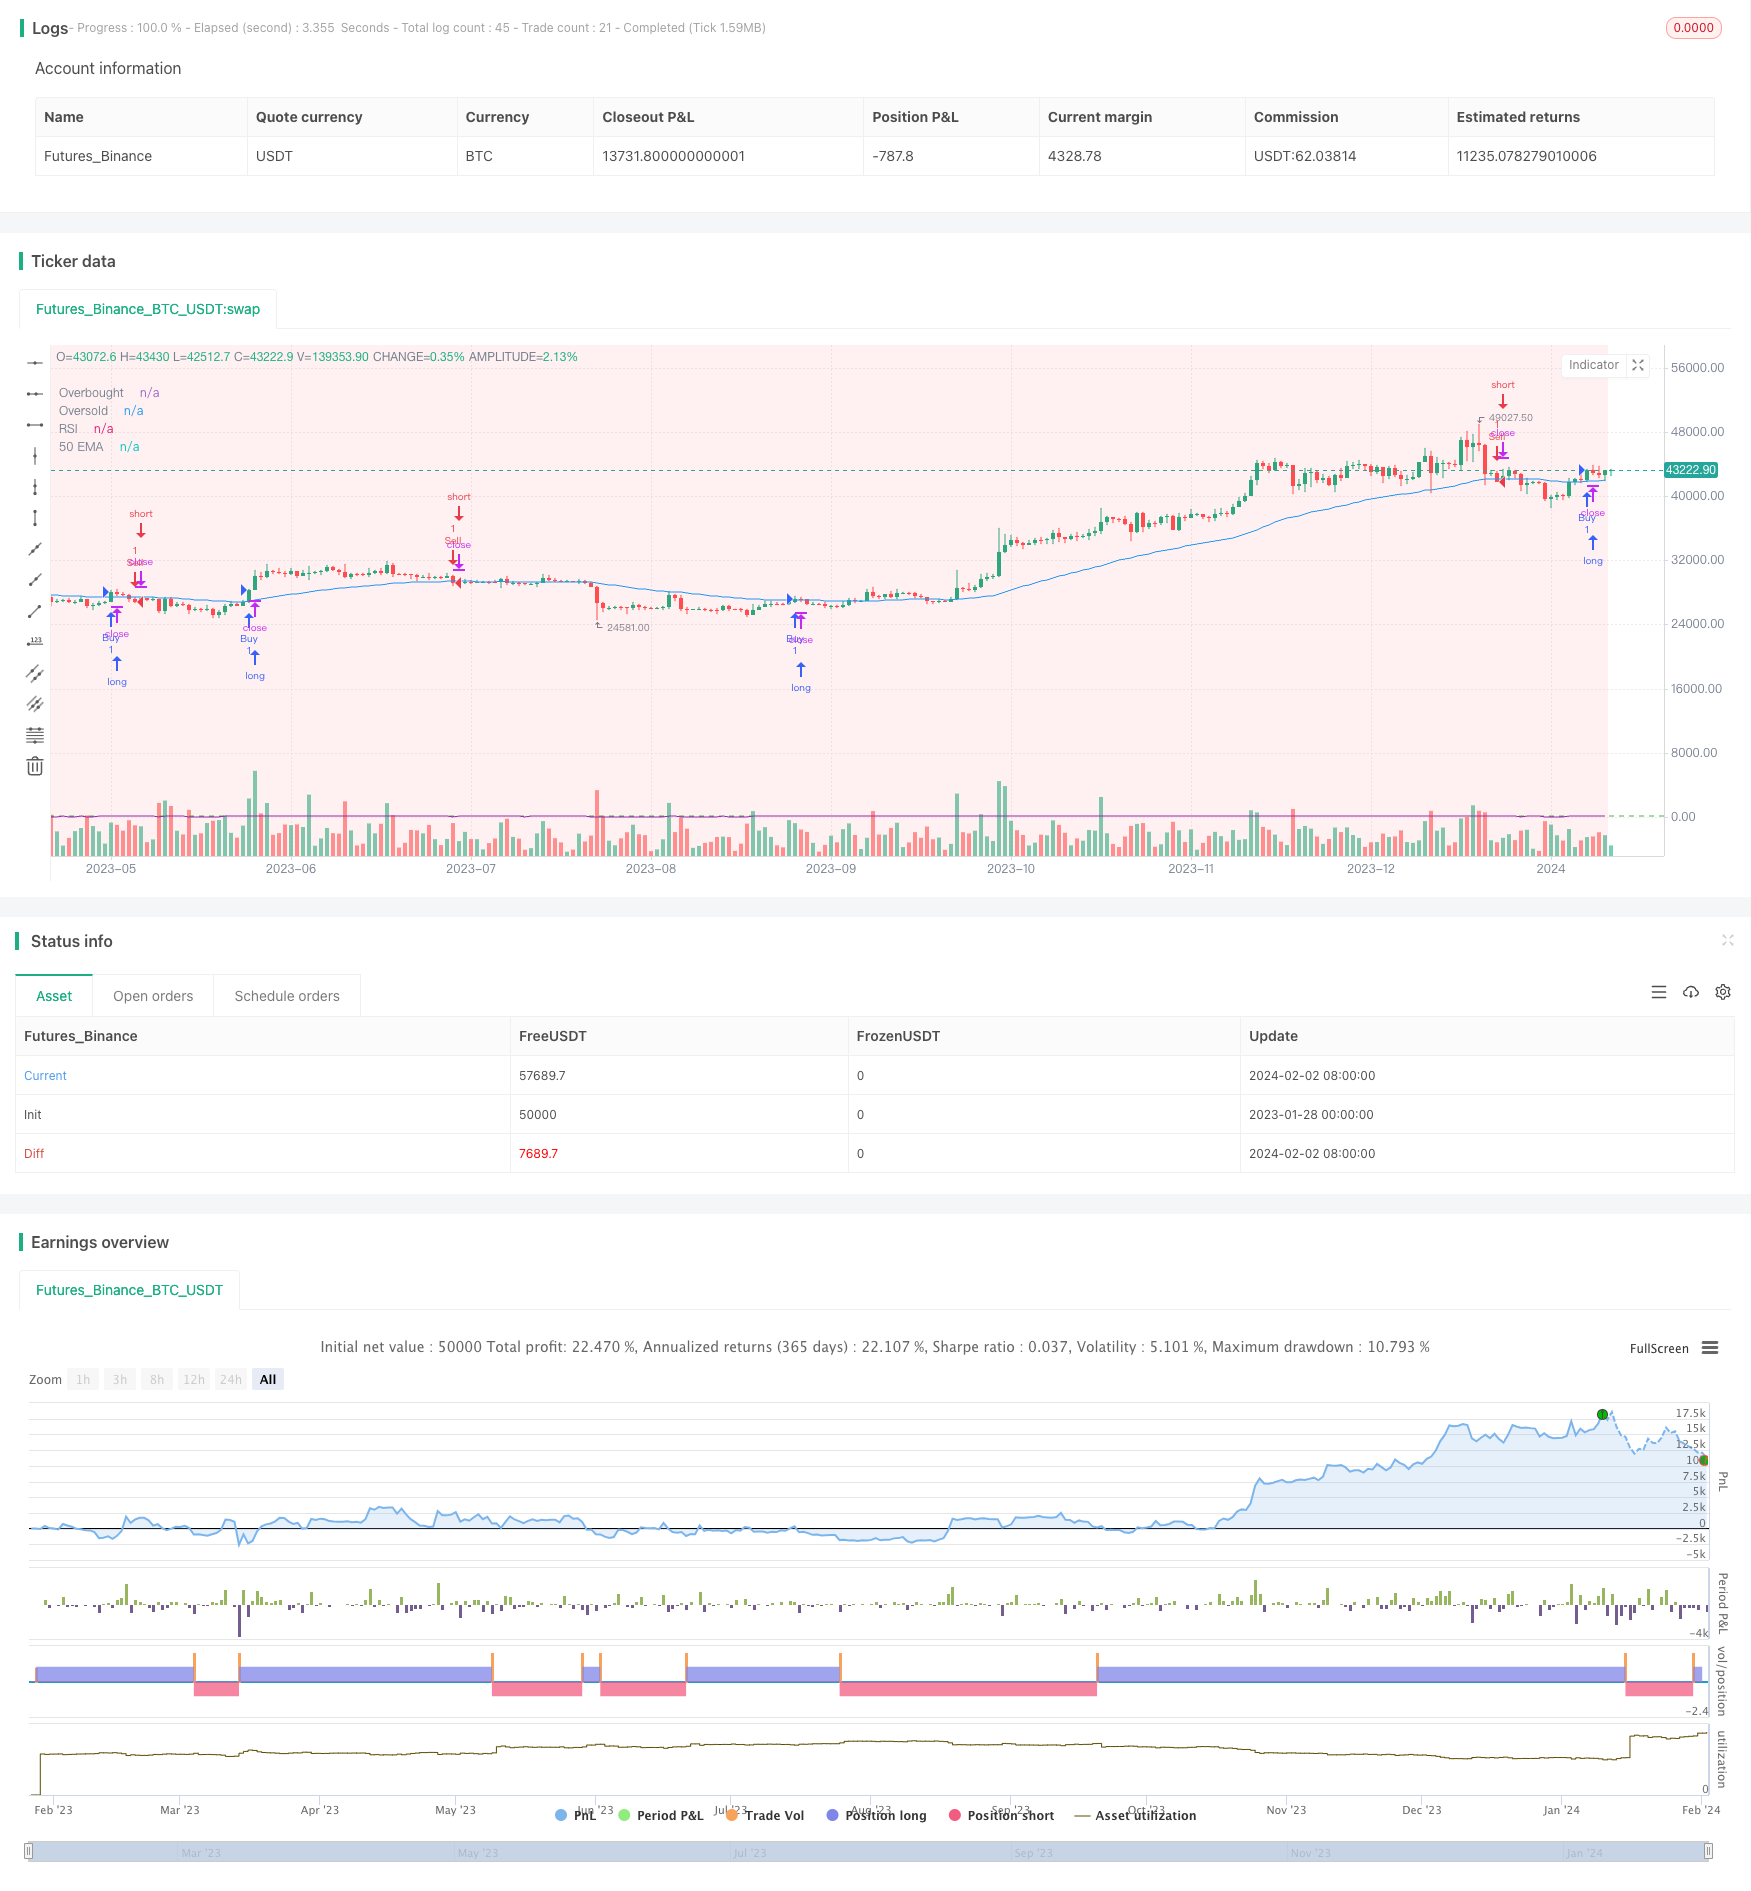
The strategy is named “Golden Cross Rules”. It combines the Exponential Moving Average (EMA) and the Relative Strength Index (RSI) for quantitative trading. The main idea is to buy in high demand zones and sell in high supply zones, using EMA to determine the overall trend and RSI to spot overbought/oversold areas.
Principles
The strategy first calculates the 50-day EMA and 14-day RSI. Then it sets up Bollinger Bands as high demand and supply zones. When the price goes above 50-day EMA and RSI goes over 55, it triggers the buy signal. When the price falls below 50-day EMA and RSI drops below 45, it triggers the sell signal. The entry points are buying in the high demand zone and selling in the high supply zone.
Specifically, when the closing price breaks above 50-day EMA and is in the high demand zone, it sends the buy signal. When the closing price breaks below 50-day EMA and is in the high supply zone, it sends the sell signal. By doing so, it uses EMA to spot the major trend and RSI to identify overbought/oversold extremities. It places counter-trend tactical trades in those extremities to gain higher winning odds.
Advantage Analysis
The strategy combines both EMA and RSI, which effectively determines market trends and overbought/oversold zones. EMA smooths out prices for detecting major trends while RSI spots local reversals. The two complement each other to avoid false signals.
In addition, the strategy introduces the concepts of high demand/supply zones, which utilizes the overbought/oversold areas set by Bollinger Bands. This filters out most noise and only trades at extremities, hence lifting the winning rate.
In conclusion, the strategy synthesizes multiple indicators and concepts to take advantage of different tools. The pincer attack forms a robust stock picking and timing mechanism, delivering superior profitability.
Risk Analysis
The biggest risk of this strategy lies in setting up the Bollinger Bands. If the high demand and supply zones are set too wide or too narrow, it would lead to frequent losses. Proper parameter tuning based on specific stock characteristics and market regimes is a must.
Another potential risk is the occurrence of prolonged topping or bottoming of the market, where EMA and RSI may give out concurrent false signals. In those cases, manual intervention is required to pause the strategy and avoid huge losses.
Optimization Directions
Firstly, machine learning algorithms can be introduced to enable dynamic parameter optimization, such as using reinforcement learning to adjust Bollinger Bands, or applying LSTM to optimize EMA and RSI parameters.
Secondly, by leveraging text mining and NLP technologies, market sentiment data can be collected to empower trading decisions. Manual override of the strategy during extreme market sentiment would help circumvent risks.
Thirdly, stock screening strategies can be combined. By first selecting stocks with growth potential using deep learning, then timing trades with this strategy, the overall performance can be lifted.
Conclusion
In conclusion, this is a solid strategy with appropriate indicator combos and obvious edge, while keeping risks in check. Further performance boost can be expected by optimizing with machine learning and text analytics. It has the potential to become a new paradigm of quantitative trading strategies.
/*backtest
start: 2023-01-28 00:00:00
end: 2024-02-03 00:00:00
period: 1d
basePeriod: 1h
exchanges: [{"eid":"Futures_Binance","currency":"BTC_USDT"}]
*/

//@version=5
strategy("Powerful EMA and RSI Strategy", overlay=true)

// Define EMA parameters
ema50 = ta.ema(close, 50)

// Calculate RSI
rsiLength = input(14, title="RSI Length")
rsiValue = ta.rsi(close, rsiLength)

// Define Demand and Supply zones
demandZone = input(true, title="Demand Zone")
supplyZone = input(true, title="Supply Zone")

// Define Buy and Sell conditions
buyCondition = close > ema50 and rsiValue > 55
sellCondition = close < ema50 and rsiValue < 45

// Entry point buy when the price is closed above 50 EMA at Demand area
buyEntryCondition = close > ema50 and demandZone
strategy.entry("Buy", strategy.long, when=buyCondition and buyEntryCondition)

// Entry point sell when the price is closed below 50 EMA at Supply area
sellEntryCondition = close < ema50 and supplyZone
strategy.entry("Sell", strategy.short, when=sellCondition and sellEntryCondition)

// Plot 50 EMA for visualization
plot(ema50, color=color.blue, title="50 EMA")

// Plot RSI for visualization
hline(55, "Overbought", color=color.red)
hline(45, "Oversold", color=color.green)
plot(rsiValue, color=color.purple, title="RSI")

// Plot Demand and Supply zones
bgcolor(demandZone ? color.new(color.green, 90) : na)
bgcolor(supplyZone ? color.new(color.red, 90) : na)
- Renko and Relative Vigor Index Trend Following Strategy
- Swing Trend Moving Average Strategy
- Bollinger Band, Moving Average and MACD Combined Trading Strategy
- Momentum Price Climbing Crypto Currency Strategy
- Momentum Trading Strategy Based on Multi-factor Model
- Adaptive Bollinger Bands Trend Tracking Strategy
- Improved RSI Breakout Strategy with Stop Loss and Take Profit
- Quantitative Trading Strategy Based on RSI and Bollinger Bands
- Quantitative Trading Strategy Based on SMA and Rolling Trendline
- Stochastic Weekly Options Trading Strategy
- Bollinger Bands and RSI Combination Trading Strategy
- Demigod Candlestick MACD Divergence Trend Following Strategy
- Dual Moving Average Cross Timeframe Trading Strategy
- Dual Indicator Stochastic RSI and EMA Trading Strategy
- SMA Crossover Bullish Trend Following Strategy
- Bollinger Bands Breakout Quantitative Trading Strategy
- Trend Following Strategy Based on Multi-Period SMA
- Market Sentiment-Based Ichimoku Breakout Strategy
- Dynamic Multi-indicator Quantitative Trading Strategy
- Coral Trend Pullback Strategy