Stochastic Weekly Options Trading Strategy
Author: ChaoZhang, Date: 2024-02-04 15:14:43Tags:

Overview
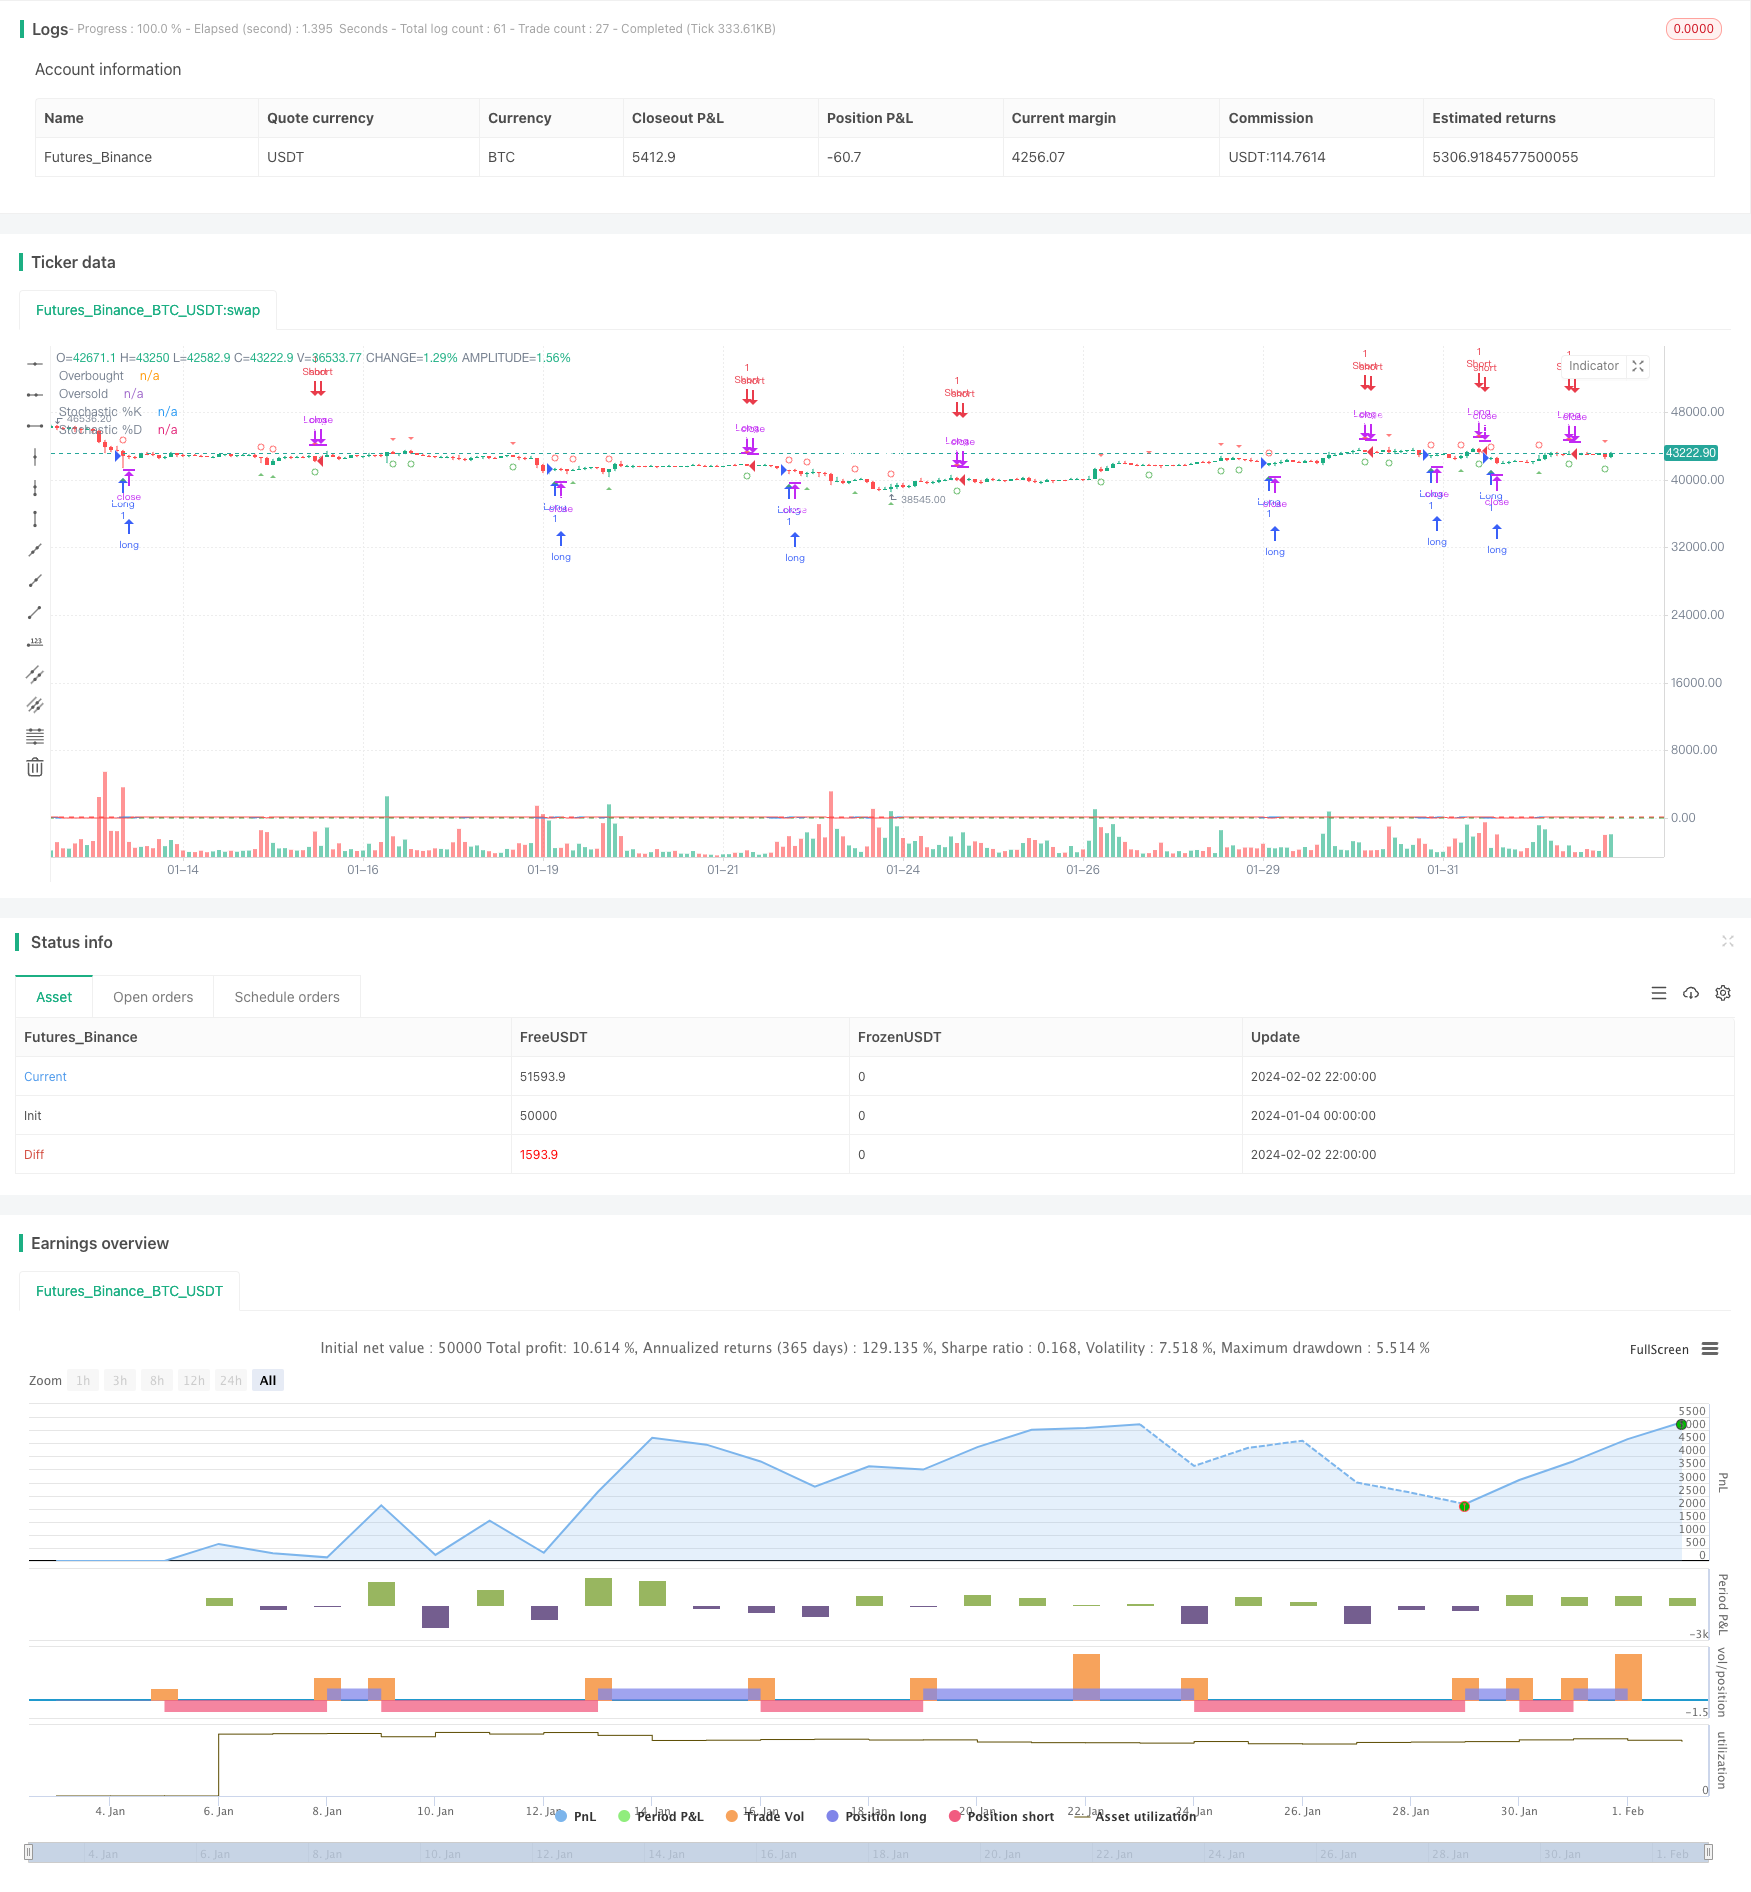
This strategy named “Stochastic Weekly Options Trading Strategy” uses the Stochastic oscillator to identify potential entry and exit points for options trading on both long and short sides. It is tailored for options trading with ability to capture trading opportunities in two directions.
Strategy Logic
The strategy plots a 14-period Stochastic %K line and a 3-period simple moving average line as Stochastic %D. An upcross of %K over %D is treated as a bullish signal. A downcross of %K below %D signals a bearish move. Specific entry and exit rules are defined as below:
Long Entry: %K crosses above %D while %K is below 20 Long Exit: %K crosses below %D while %K is above 80 Short Entry: %K crosses below %D while %K is above 80 Short Exit: %K crosses above %D while %K is below 20
Advantages
- Identify overbought and oversold zones using Stochastic to avoid buying tops and selling bottoms
- Filter signals and improve quality through parameter optimization
- Customizable entry and exit rules to refine position management
- Efficient leverage for options trading with risk control
Risk Analysis
- Stochastic is prone to generating false signals - requires filter from other indicators
- Fixed parameter setting may miss some trading opportunities
- Drawdown risk due to volatile markets
- Pay attention to fundamentals and macro environment
Optimization Directions
- Add filters like moving averages to screen false signals
- Test different parameter combinations to find optimum
- Increase width of breakout zones to avoid false signals
- Optimize stop loss and take profit for better risk control
Conclusion
This strategy captures potential turning points by identifying overbought/oversold levels using Stochastic. Compared to trend-following tactics, it aims to capture bigger moves at inflection points. Further enhancements through parameter tuning, signal filtering can improve strategy stability. With balanced risk management, the options-focused approach allows efficient capital deployment for higher reward potential.
/*backtest
start: 2024-01-04 00:00:00
end: 2024-02-03 00:00:00
period: 2h
basePeriod: 15m
exchanges: [{"eid":"Futures_Binance","currency":"BTC_USDT"}]
*/

//@version=5
strategy("Stochastic Weekly Options Strategy", overlay=true, shorttitle="WOS")

// Stochastic settings
K = ta.stoch(close, high, low, 14)
D = ta.sma(K, 3)

// Entry and exit conditions
longEntry = ta.crossover(K, 20)
longExit = ta.crossunder(K, 80)

shortEntry = ta.crossunder(K, 80)
shortExit = ta.crossover(K, 20)

// Strategy execution
strategy.entry("Long", strategy.long, when=longEntry)
strategy.close("Long", when=longExit)

strategy.entry("Short", strategy.short, when=shortEntry)
strategy.close("Short", when=shortExit)

// Alert conditions
alertcondition(longEntry, title="Long Entry Alert", message="Stochastic bullish crossover! Consider buying a call option.")
alertcondition(longExit, title="Long Exit Alert", message="Stochastic bearish crossover! Consider selling the call option.")
alertcondition(shortEntry, title="Short Entry Alert", message="Stochastic bearish crossover! Consider buying a put option.")
alertcondition(shortExit, title="Short Exit Alert", message="Stochastic bullish crossover! Consider selling the put option.")

// Plotting shapes for buy and sell signals
plotshape(longEntry, title="Calls Entry Label", color=color.new(color.green, 25),
     textcolor=color.white, style=shape.triangleup, text="Calls", location=location.belowbar, size=size.small)

plotshape(longExit, title="Calls Exit Label", color=color.new(color.green, 25),
     textcolor=color.white, style=shape.circle, text="Exit", location=location.belowbar, size=size.small)

plotshape(shortEntry, title="Puts Entry Label", color=color.new(color.red, 25),
     textcolor=color.white, style=shape.triangledown, text="Puts", location=location.abovebar, size=size.small)

plotshape(shortExit, title="Puts Exit Label", color=color.new(color.red, 25),
     textcolor=color.white, style=shape.circle, text="Exit", location=location.abovebar, size=size.small)

// Plotting
plot(K, color=color.blue, title="Stochastic %K")
plot(D, color=color.red, title="Stochastic %D")
hline(80, "Overbought", color=color.red)
hline(20, "Oversold", color=color.green)
- Quadratic Momentum Double Indicators Timing Strategy
- Renko and Relative Vigor Index Trend Following Strategy
- Swing Trend Moving Average Strategy
- Bollinger Band, Moving Average and MACD Combined Trading Strategy
- Momentum Price Climbing Crypto Currency Strategy
- Momentum Trading Strategy Based on Multi-factor Model
- Adaptive Bollinger Bands Trend Tracking Strategy
- Improved RSI Breakout Strategy with Stop Loss and Take Profit
- Quantitative Trading Strategy Based on RSI and Bollinger Bands
- Quantitative Trading Strategy Based on SMA and Rolling Trendline
- Powerful EMA and RSI Quantitative Trading Strategy
- Bollinger Bands and RSI Combination Trading Strategy
- Demigod Candlestick MACD Divergence Trend Following Strategy
- Dual Moving Average Cross Timeframe Trading Strategy
- Dual Indicator Stochastic RSI and EMA Trading Strategy
- SMA Crossover Bullish Trend Following Strategy
- Bollinger Bands Breakout Quantitative Trading Strategy
- Trend Following Strategy Based on Multi-Period SMA
- Market Sentiment-Based Ichimoku Breakout Strategy
- Dynamic Multi-indicator Quantitative Trading Strategy