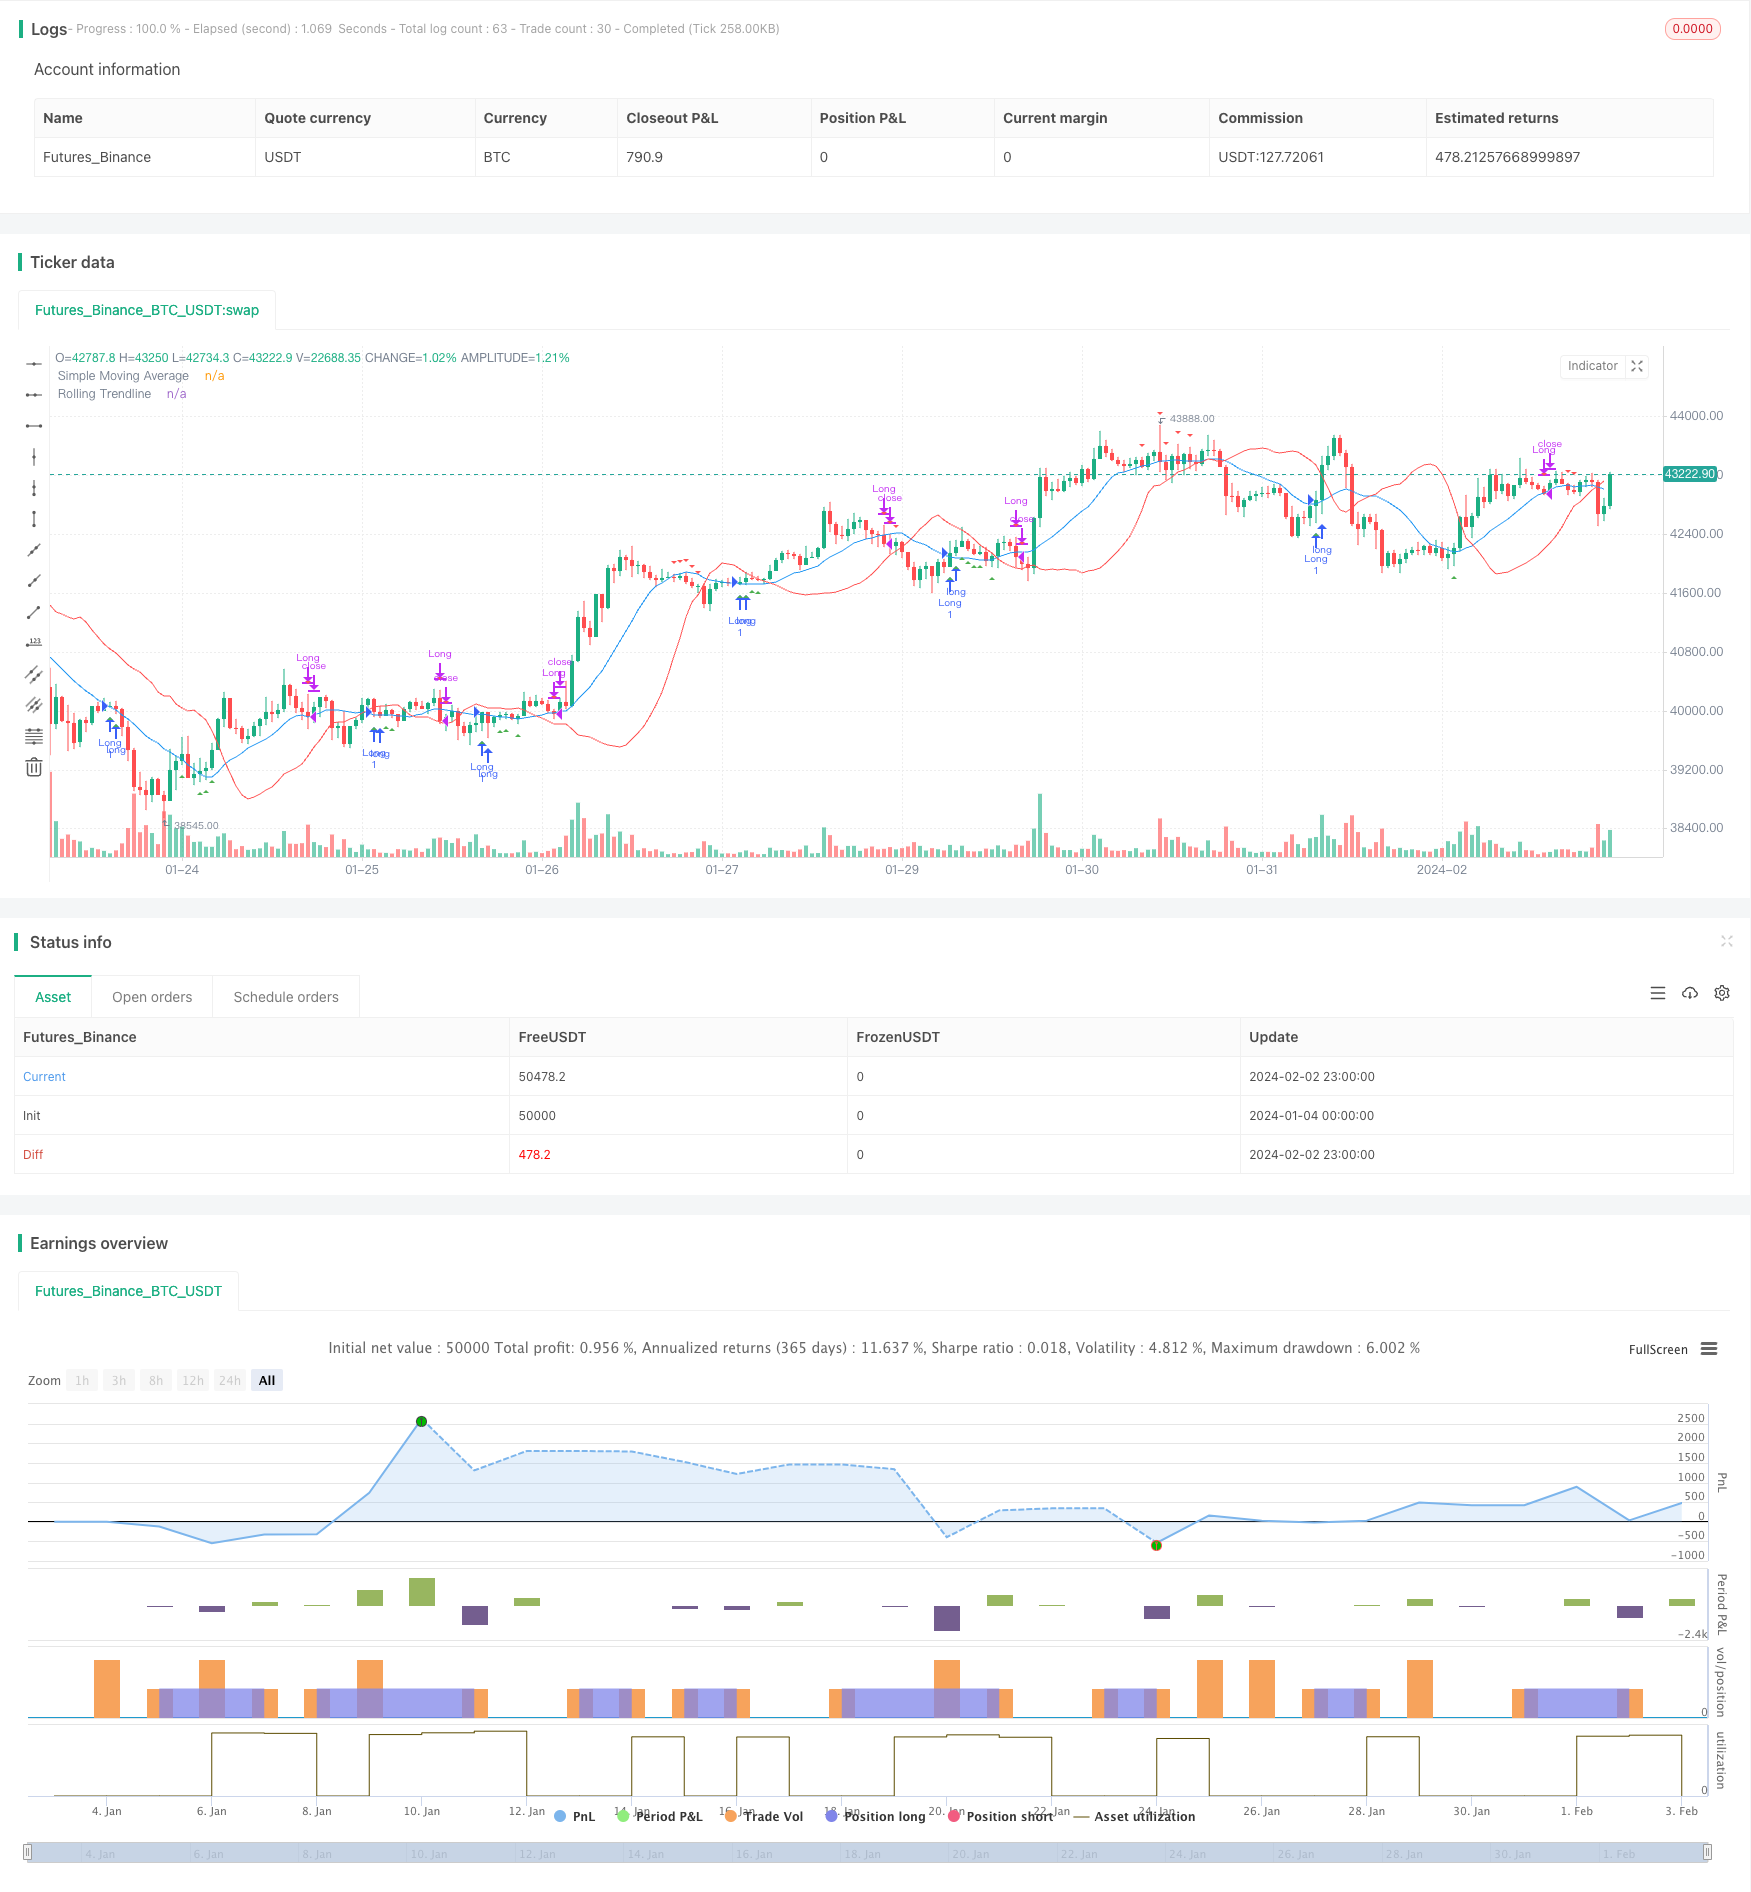
Quantitative Trading Strategy Based on SMA and Rolling Trendline
Author: ChaoZhang, Date: 2024-02-04 15:18:12Tags:

Overview
This strategy combines the Simple Moving Average (SMA) and rolling linear regression trendline. It sets the long entry condition when the close price is above both SMA and trendline, and exit condition when the close price is below them. The strategy mainly utilizes the SMA as trading signal and rolling trendline for channel support. It enters trade when breakout of the upside channel and exits when breakout of the downside channel.
Strategy Logic
The key components of this strategy include:
SMA: Simple moving average, calculating average close price over a period (smaPeriod) as signal line.
Rolling Trendline: Fitting the best linear regression line over a window (window) as trend signal. Calculated by Ordinary Least Square method.
Entry Condition: Go long when close price > SMA and trendline.
Exit Condition: Close position when close price < SMA and trendline.
So the strategy mainly relies on SMA signal breakout for entry, and channel breakout for exit. It utilizes the mean reversion attribute of MA and channel support by linear regression line to implement trend following breakout operations.
Advantage Analysis
This strategy integrates dual filter of MA and trendline, which can effectively reduce false breakout trades. Meanwhile, rolling trendline provides more precise channel support for reliable decisions. The main advantages include:
- Dual filter mechanism avoids false breakout and improves decision accuracy.
- Rolling trendline offers dynamic channel support for more accurate channel trading.
- Simple and intuitive trading logic, easy to understand and implement.
- Customizable parameters adapt to different market environments.
Risk Analysis
There are also some risks of this strategy:
- Improper parameters of SMA and trendline may lead to missing trades or too many false breakouts.
- In highly volatile markets, the channel support by SMA and trendline may weaken.
- Failed breakout can lead to losses, strict stop loss is required.
Some optimizing directions for these risks:
- Optimize parameters for different products.
- Increase stop loss range to reduce single loss.
- Suspend trading in volatile market to avoid being trapped.
Strategy Optimization
This strategy can be optimized in the following aspects:
Add dynamic adjustment functions for SMA period, slippage parameters based on market regimes.
Develop elastic stop loss mechanism. Set stop loss when price breaks trendline at a ratio.
Add filter from other indicators e.g. Volume, RSI to improve decision accuracy.
Develop reversal version. Go long when price approaches bottom and breaks the downside channel.
Conclusion
This strategy integrates the trading signals from moving average and channel support from rolling trendline to implement trend following operations. The dual filter reduces false breakout probability and improves decision quality. It has simple parameters settings and clear logics, which is easy to implement and optimize. In summary, this strategy forms a reliable, simple and intuitive trend breakout trading system.
/*backtest
start: 2024-01-04 00:00:00
end: 2024-02-03 00:00:00
period: 1h
basePeriod: 15m
exchanges: [{"eid":"Futures_Binance","currency":"BTC_USDT"}]
*/

//@version=4
strategy("SMA Strategy with Rolling Trendline", overlay=true)

// Input parameters
smaPeriod = input(14, title="SMA Period")
window = input(20, title="Trendline Window")
startDate = input(timestamp("2023-01-01"), title="Start Date")
endDate = input(timestamp("2023-12-31"), title="End Date")

// Calculating SMA
sma = sma(close, smaPeriod)

// Function to calculate linear regression trendline for a window
linreg_trendline(window) =>
    sumX = 0.0
    sumY = 0.0
    sumXY = 0.0
    sumX2 = 0.0
    for i = 0 to window - 1
        sumX := sumX + i
        sumY := sumY + close[i]
        sumXY := sumXY + i * close[i]
        sumX2 := sumX2 + i * i
    slope = (window * sumXY - sumX * sumY) / (window * sumX2 - sumX * sumX)
    intercept = (sumY - slope * sumX) / window
    slope * (window - 1) + intercept

// Calculating the trendline
trendline = linreg_trendline(window)

// Entry and Exit Conditions
longCondition = close > sma and close < trendline
exitLongCondition = close < sma and close > trendline

// Strategy logic
if (true)
    if (longCondition)
        strategy.entry("Long", strategy.long)
    if (exitLongCondition)
        strategy.close("Long")

// Plotting
plot(sma, title="Simple Moving Average", color=color.blue)
plot(trendline, title="Rolling Trendline", color=color.red)
plotshape(series=longCondition, title="Enter Trade", location=location.belowbar, color=color.green, style=shape.triangleup)
plotshape(series=exitLongCondition, title="Exit Trade", location=location.abovebar, color=color.red, style=shape.triangledown)
- Dual Moving Average Trend Tracking Strategy
- Quadratic Momentum Double Indicators Timing Strategy
- Renko and Relative Vigor Index Trend Following Strategy
- Swing Trend Moving Average Strategy
- Bollinger Band, Moving Average and MACD Combined Trading Strategy
- Momentum Price Climbing Crypto Currency Strategy
- Momentum Trading Strategy Based on Multi-factor Model
- Adaptive Bollinger Bands Trend Tracking Strategy
- Improved RSI Breakout Strategy with Stop Loss and Take Profit
- Quantitative Trading Strategy Based on RSI and Bollinger Bands
- Stochastic Weekly Options Trading Strategy
- Powerful EMA and RSI Quantitative Trading Strategy
- Bollinger Bands and RSI Combination Trading Strategy
- Demigod Candlestick MACD Divergence Trend Following Strategy
- Dual Moving Average Cross Timeframe Trading Strategy
- Dual Indicator Stochastic RSI and EMA Trading Strategy
- SMA Crossover Bullish Trend Following Strategy
- Bollinger Bands Breakout Quantitative Trading Strategy
- Trend Following Strategy Based on Multi-Period SMA
- Market Sentiment-Based Ichimoku Breakout Strategy