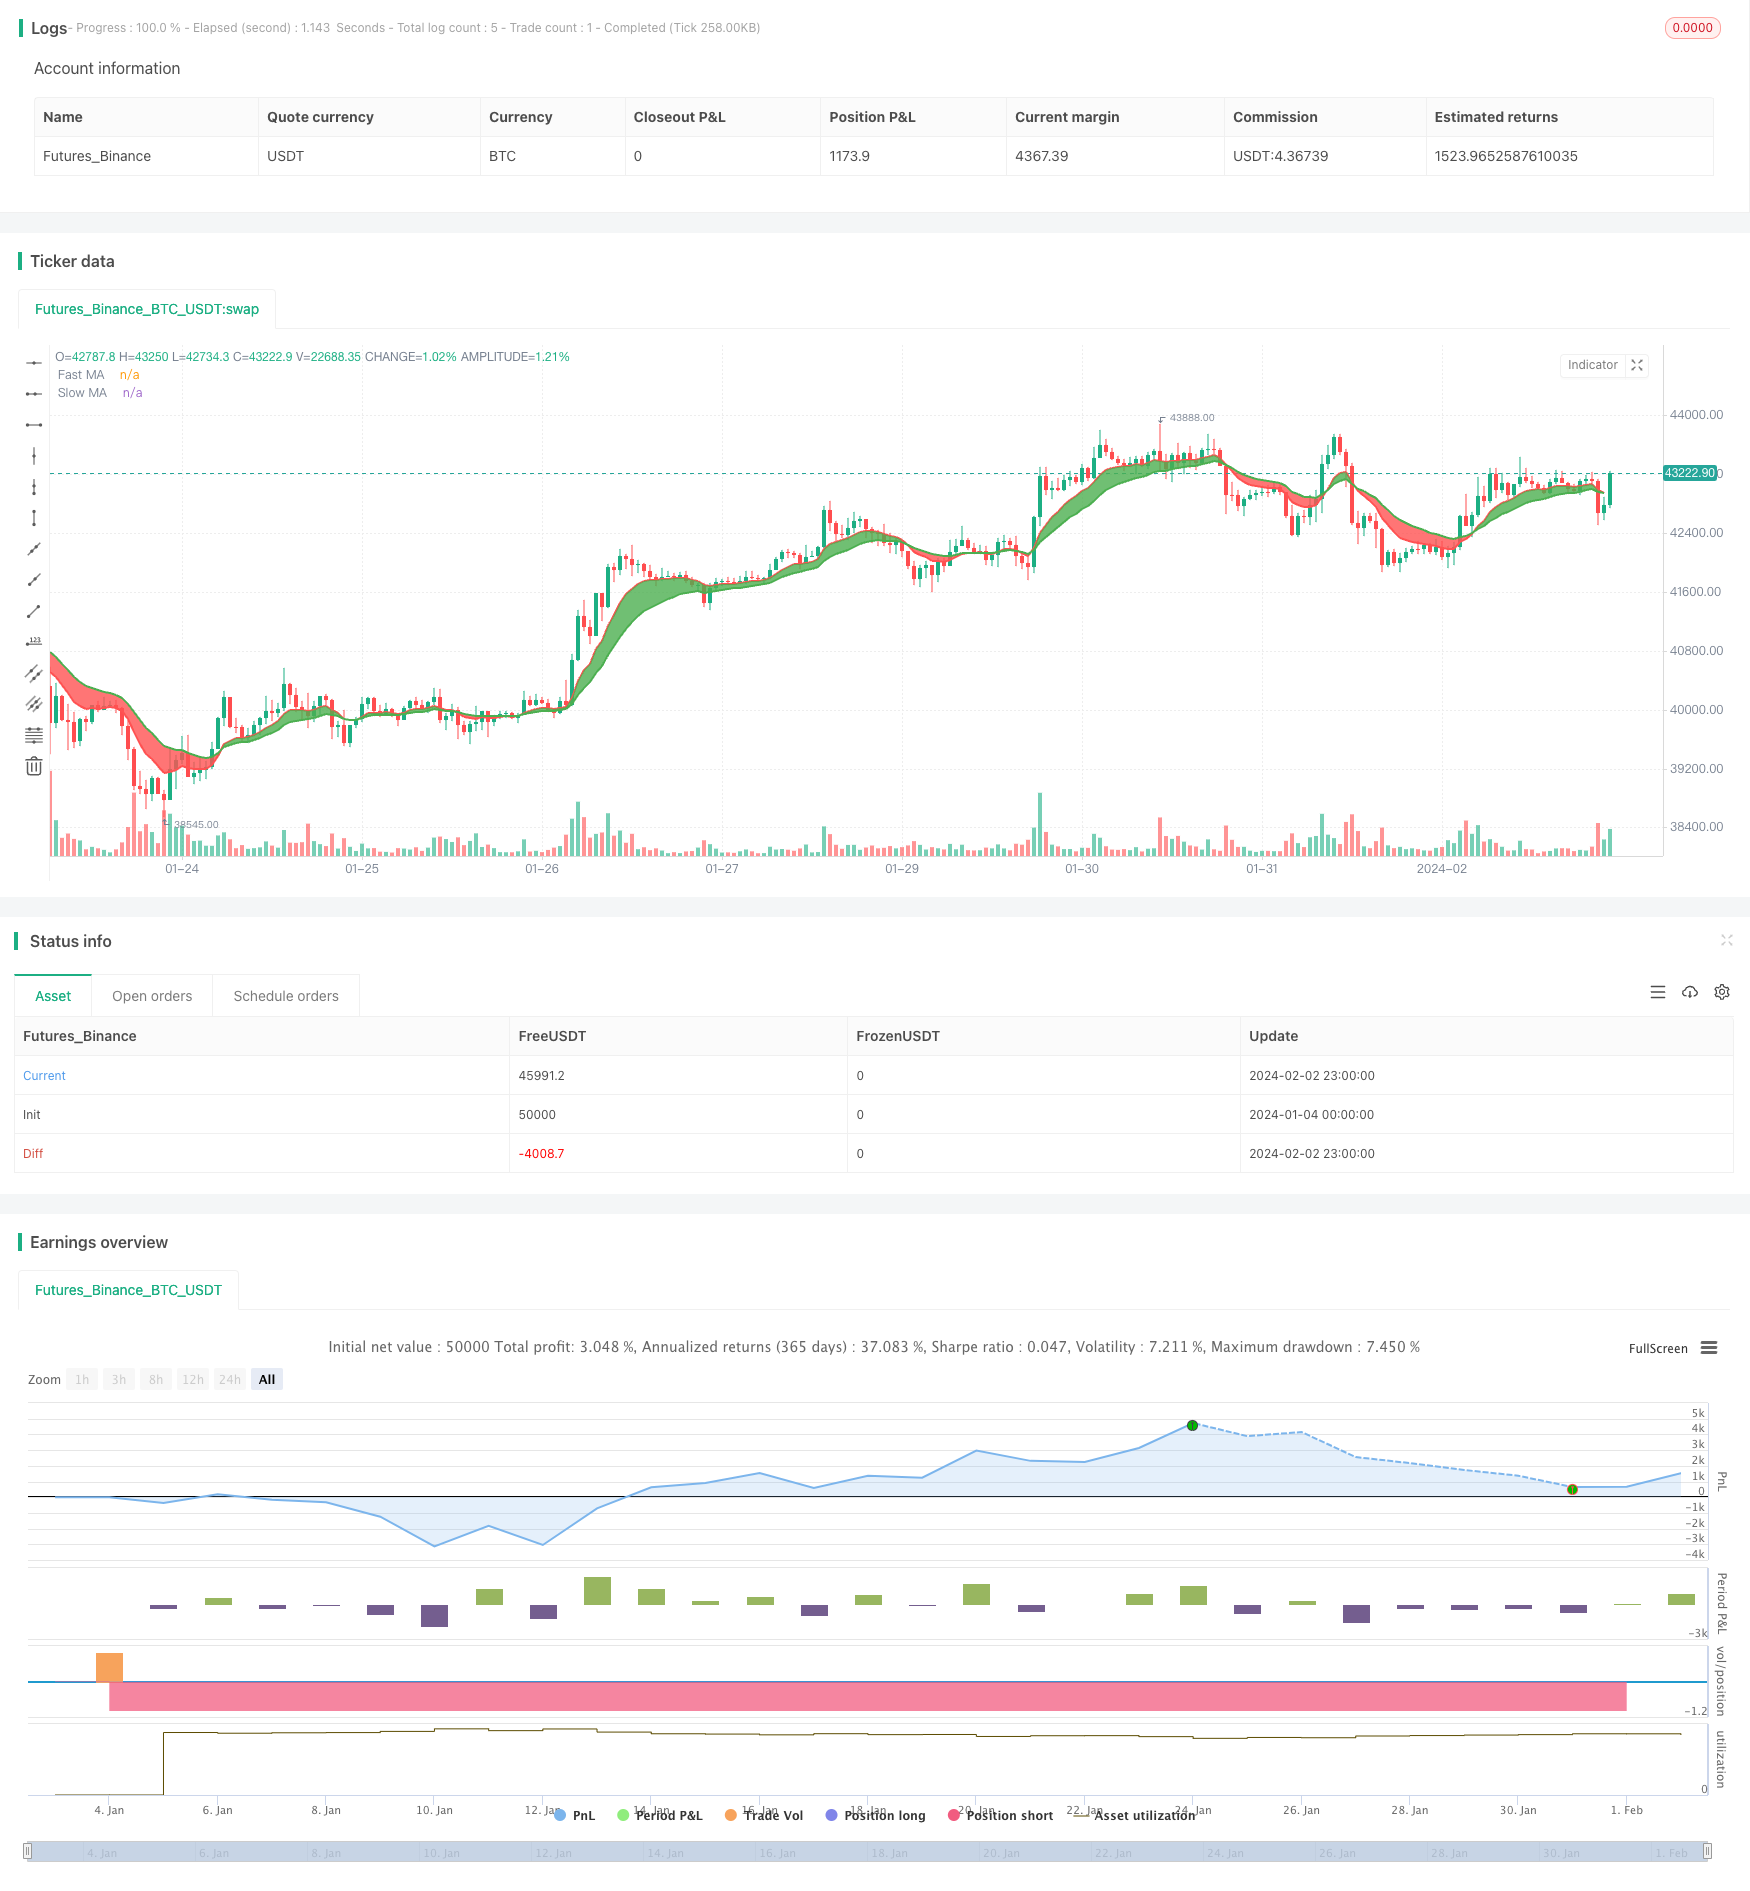
Overview
The moving average crossover strategy is a common stock trading strategy. It generates buying and selling signals by calculating fast and slow moving averages and detecting their crossover points. Specifically, when the fast moving average crosses above the slow moving average from below, it generates a buy signal; when the fast moving average crosses below the slow moving average from above, it generates a sell signal.
Strategy Logic
The core logic of this strategy is: the fast moving average represents the short-term trend of a stock, while the slow moving average represents its long-term trend. When the short-term trend turns upward (golden cross), it indicates the stock may enter a buy zone; when the short-term trend turns downward (death cross), it indicates the stock may enter a sell zone.
In this strategy, the fast moving average maFast and slow moving average maSlow are defined. maFast has a period of 9 representing the 9-day short-term trend of a stock. maSlow has a period of 18 representing the 18-day long-term trend. The strategy detects their crossover to determine changes in short-term and long-term trends. It generates a buy signal when maFast crosses above maSlow, and a sell signal when maFast crosses below maSlow.
Advantage Analysis
The advantages of this strategy are:
- Its logic is simple and easy to understand and implement.
- Moving averages can filter out price noises effectively and generate reliable trading signals.
- The fast and slow MAs combine short-term and long-term trends, making the signals stable.
- The MA parameters can be adjusted flexibly to adapt to different stocks.
- Further optimizations on the MA period parameters can lead to better trading performance.
Risk Analysis
There are also some risks with this strategy:
- More incorrect signals and excessive trading can happen when price fluctuation is high.
- Improper parameter settings may cause too frequent trading or signal delay.
- It cannot track rapidly changing market and individual stocks effectively.
- There can be some time lag, which may cause missing important entry or exit spots.
These risks can be reduced by adjusting MA parameters, setting stop loss strategies etc.
Optimization Directions
There are further optimization spaces for this strategy:
- Combine other technical indicators to filter signals, e.g. trading volume, STOCH.
- Add trend determination mechanism to avoid missing major trends.
- Optimize MA parameters to find the best combination.
- Set stop loss strategies to control single trade loss.
- Incorporate deep learning models to predict price movements.
Conclusion
In conclusion, the moving average crossover strategy is a very classic and practical strategy overall. It has simple logic and wide applications in actual trading. By parameter tuning and combining other technical indicators, it can be further improved to achieve better risk-reward ratios. In general, it is an important cornerstone of quantitative trading and deserves in-depth research and application.
/*backtest
start: 2024-01-04 00:00:00
end: 2024-02-03 00:00:00
period: 1h
basePeriod: 15m
exchanges: [{"eid":"Futures_Binance","currency":"BTC_USDT"}]
*/

//@version=3
strategy(title="Moving Average Cross", overlay=true, initial_capital=10000, currency='USD')


// === GENERAL INPUTS ===
// short ma
maFastSource   = input(defval = close, title = "Fast MA Source")
maFastLength   = input(defval = 9, title = "Fast MA Period", minval = 1)
// long ma
maSlowSource   = input(defval = close, title = "Slow MA Source")
maSlowLength   = input(defval = 18, title = "Slow MA Period", minval = 1)


// === SERIES SETUP ===
/// a couple of ma's..
maFast = ema(maFastSource, maFastLength)
maSlow = ema(maSlowSource, maSlowLength)


// === PLOTTING ===
fast = plot(maFast, title = "Fast MA", color = red, linewidth = 2, style = line, transp = 30)
slow = plot(maSlow, title = "Slow MA", color = green, linewidth = 2, style = line, transp = 30)


// === LOGIC ===
enterLong = crossover(maFast, maSlow)
exitLong = crossover(maSlow, maFast)


// Entry //
strategy.entry(id="Long Entry", long=true, when=enterLong)
strategy.entry(id="Short Entry", long=false, when=exitLong)


// === FILL ====

fill(fast, slow, color = maFast > maSlow ? green : red)