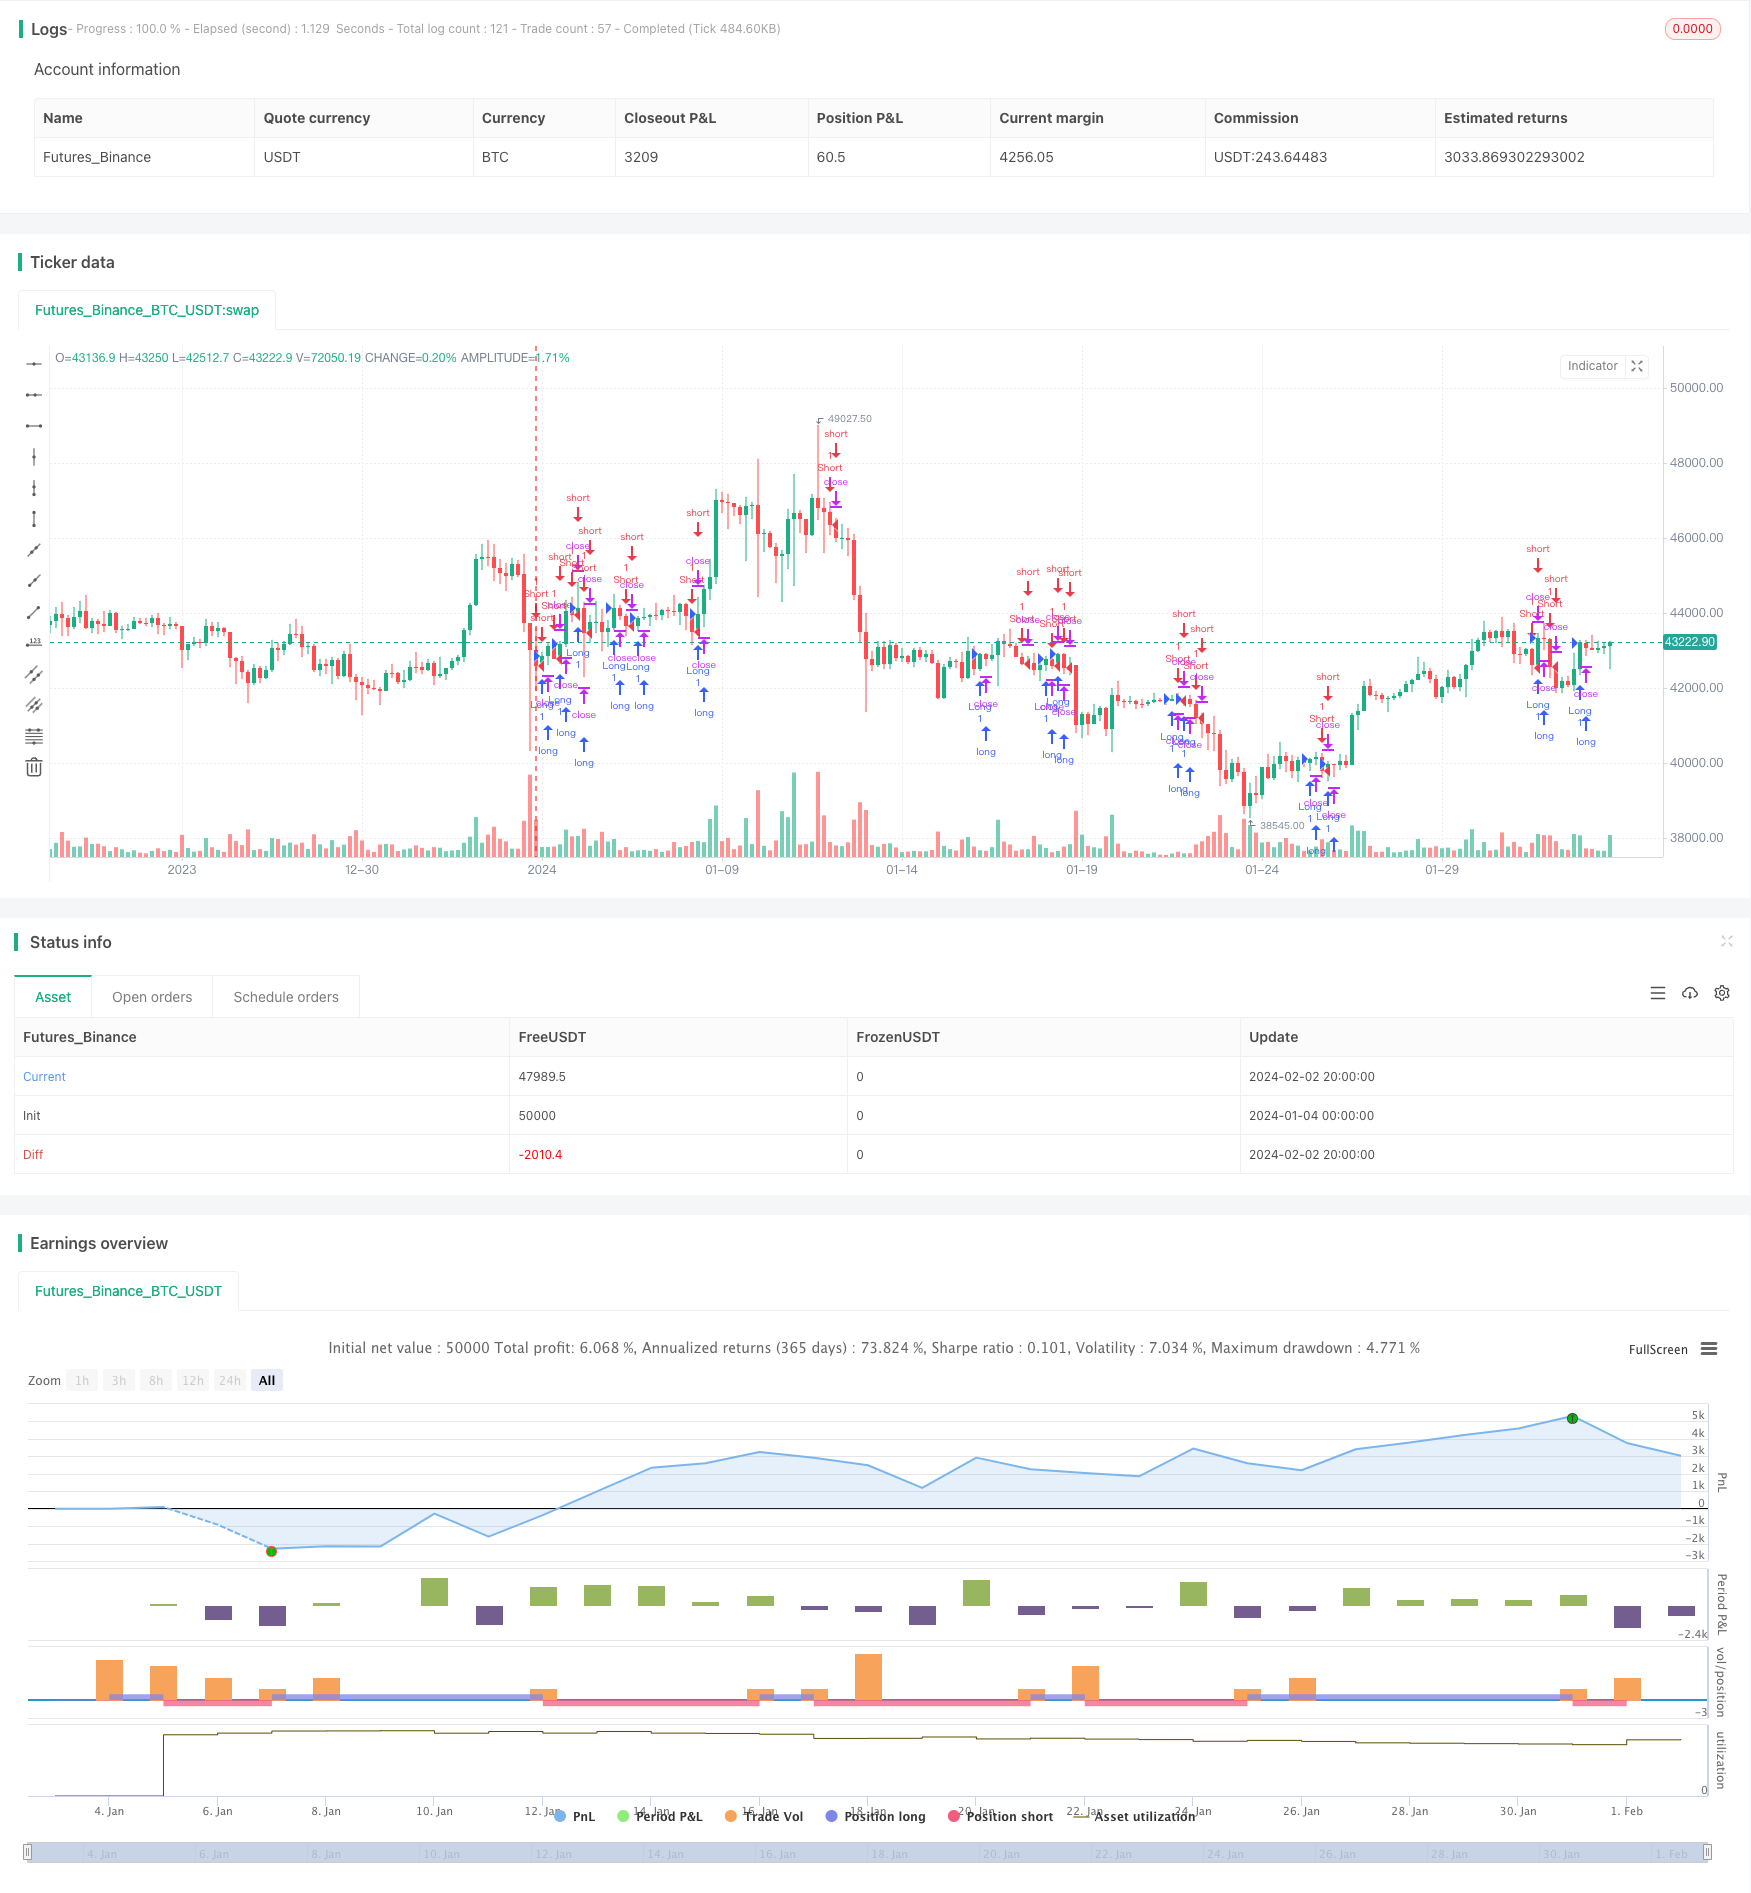
Crossover Strategy between Multiple Moving Averages
Author: ChaoZhang, Date: 2024-02-04 17:21:25Tags:

Overview
This strategy calculates moving average lines of multiple timeframes to determine the trend across different periods. It goes long when the price crosses over the moving averages and goes short when the price crosses below the moving averages. Additionally, stop loss and take profit are incorporated to balance risks and returns.
Principles
The strategy is based on the following key points:
Calculate 21-day, 50-day, 100-day and 200-day simple moving averages.
Go long when the price crosses over any of the moving averages, and go short when it crosses below.
Set the stop loss near the lowest price of the previous bar after opening long positions, and near the highest price after opening short positions.
Set take profit targets below the lowest price for longs and above the highest price for shorts within certain ranges.
Close positions when the price hits the stop loss or take profit levels.
Judging trends across multiple timeframes can improve the reliability of trading signals and allow us to follow the trends when they are relatively clear. The stop loss and take profit mechanics control risks by exiting positions when losses expand or profits reach certain levels.
Advantages
The main advantages of this strategy are:
Improved signal reliability with multiple timeframe analysis. Different moving average crossovers help filter out some false signals and allow us to trade at clearer trend moments.
Dynamic stops facilitate risk control. Calculating stops based on price action provides reasonable ranges to limit max loss on a per trade basis.
Simple and clear code structure. The Pine syntax offers readable structures to easily adjust parameters and optimize.
Easy practical application. Moving average crossovers are a classic strategy idea that can be easily implemented in live trading with proper parameter tuning.
Risks
There are also some risks to consider:
Inaccurate trend judgement. Moving averages can produce mixed signals and lag, leading to improper trade signals.
Loss exposure in volatile markets. Stop losses may get triggered easily in huge price gaps or reversals, incurring large losses.
Improper parameter setting enlarges losses. Overly wide stops or tight take profits can increase the max loss per trade.
Long holding risks. This trend following strategy does not consider long-term profitability and can consume significant capital over time.
Real trading differences. Trading costs, slippage etc. can affect returns when applied in actual trading platforms.
Solutions:
Add signal confirmation with other indicators like KDJ, MACD etc.
Adjust stop width based on market conditions to avoid premature trigger.
Optimize parameters and evaluate long-term returns and drawdowns. Obtain best parameter combinations through rigorous backtesting.
Thoroughly test strategies in paper trading and add manual stops.
Enhancement Opportunities
There is room for further improvements:
Add quantitative entry and exit rules. For example, check for new highs and lows to ensure trading at clearer trends.
Incorporate position sizing and risk management. Dynamically size positions based on account size and market conditions.
Enhance trend validation. Use indicators like PRZ, ATR, DMI etc. to filter and select appropriate trends.
Alternate long and short holding periods. Set trailing stops on profits to lock in gains.
Construct stock pool using factor investing models. Score and filter stocks on various factors.
Add machine learning for risk control. Use LSTM, RNN etc. to assist in judgement and prevent human errors.
Conclusion
This simple moving average crossover strategy offers easy implementation for trend following. The dynamic stops help control risks. But some signal inaccuracies and whipsaw risks exist. Further optimizations on parameters and additional techniques can lead to more robust performance.
/*backtest
start: 2024-01-04 00:00:00
end: 2024-02-03 00:00:00
period: 4h
basePeriod: 15m
exchanges: [{"eid":"Futures_Binance","currency":"BTC_USDT"}]
*/

//@version=5
strategy("DolarBasar by AlperDursun", shorttitle="DOLARBASAR", overlay=true)

// Input for Moving Averages
ma21 = ta.sma(close, 21)
ma50 = ta.sma(close, 50)
ma100 = ta.sma(close, 100)
ma200 = ta.sma(close, 200)

// Calculate the lowest point of the previous candle for stop loss
lowestLow = ta.lowest(low, 2)

// Calculate the highest point of the previous candle for stop loss
highestHigh = ta.highest(high, 2)

// Calculate take profit levels
takeProfitLong = lowestLow - 3 * (lowestLow - highestHigh)
takeProfitShort = highestHigh + 3 * (lowestLow - highestHigh)

// Entry Conditions
longCondition = ta.crossover(close, ma21) or ta.crossover(close, ma50) or ta.crossover(close, ma100) or ta.crossover(close, ma200)
shortCondition = ta.crossunder(close, ma21) or ta.crossunder(close, ma50) or ta.crossunder(close, ma100) or ta.crossunder(close, ma200)

// Stop Loss Levels
stopLossLong = lowestLow * 0.995
stopLossShort = highestHigh * 1.005

// Exit Conditions
longExitCondition = low < stopLossLong or high > takeProfitLong
shortExitCondition = high > stopLossShort or low < takeProfitShort

if (longCondition)
    strategy.entry("Long", strategy.long)

if (shortCondition)
    strategy.entry("Short", strategy.short)

if (longExitCondition)
    strategy.exit("Long Exit", from_entry="Long", stop=stopLossLong, limit=takeProfitLong)

if (shortExitCondition)
    strategy.exit("Short Exit", from_entry="Short", stop=stopLossShort, limit=takeProfitShort)
- Closing Price Comparison Dual Moving Average Crossover Strategy
- Ichimoku Cloud, MACD and Stochastic Based Multi-Timeframe Trend Tracking Strategy
- MACD Volume Reversal Trading Strategy
- Dynamic Moving Average Crossover Combo Strategy
- Willy Wonka Breakout Strategy
- Exponential Moving Average and Relative Strength Index Combination Trend Following Strategy
- Reversal Trend Catching and Dynamic Stop Loss Combo Strategy
- Golden Parabola Breakout Strategy
- SAR Momentum Reversal Tracking Strategy
- Dynamic RSI Trading Strategy
- Dual Moving Average Breakout Strategy
- Moving Average Crossover Strategy
- Dual Moving Average Trend Tracking Strategy
- Quadratic Momentum Double Indicators Timing Strategy
- Renko and Relative Vigor Index Trend Following Strategy
- Swing Trend Moving Average Strategy
- Bollinger Band, Moving Average and MACD Combined Trading Strategy
- Momentum Price Climbing Crypto Currency Strategy
- Momentum Trading Strategy Based on Multi-factor Model
- Adaptive Bollinger Bands Trend Tracking Strategy