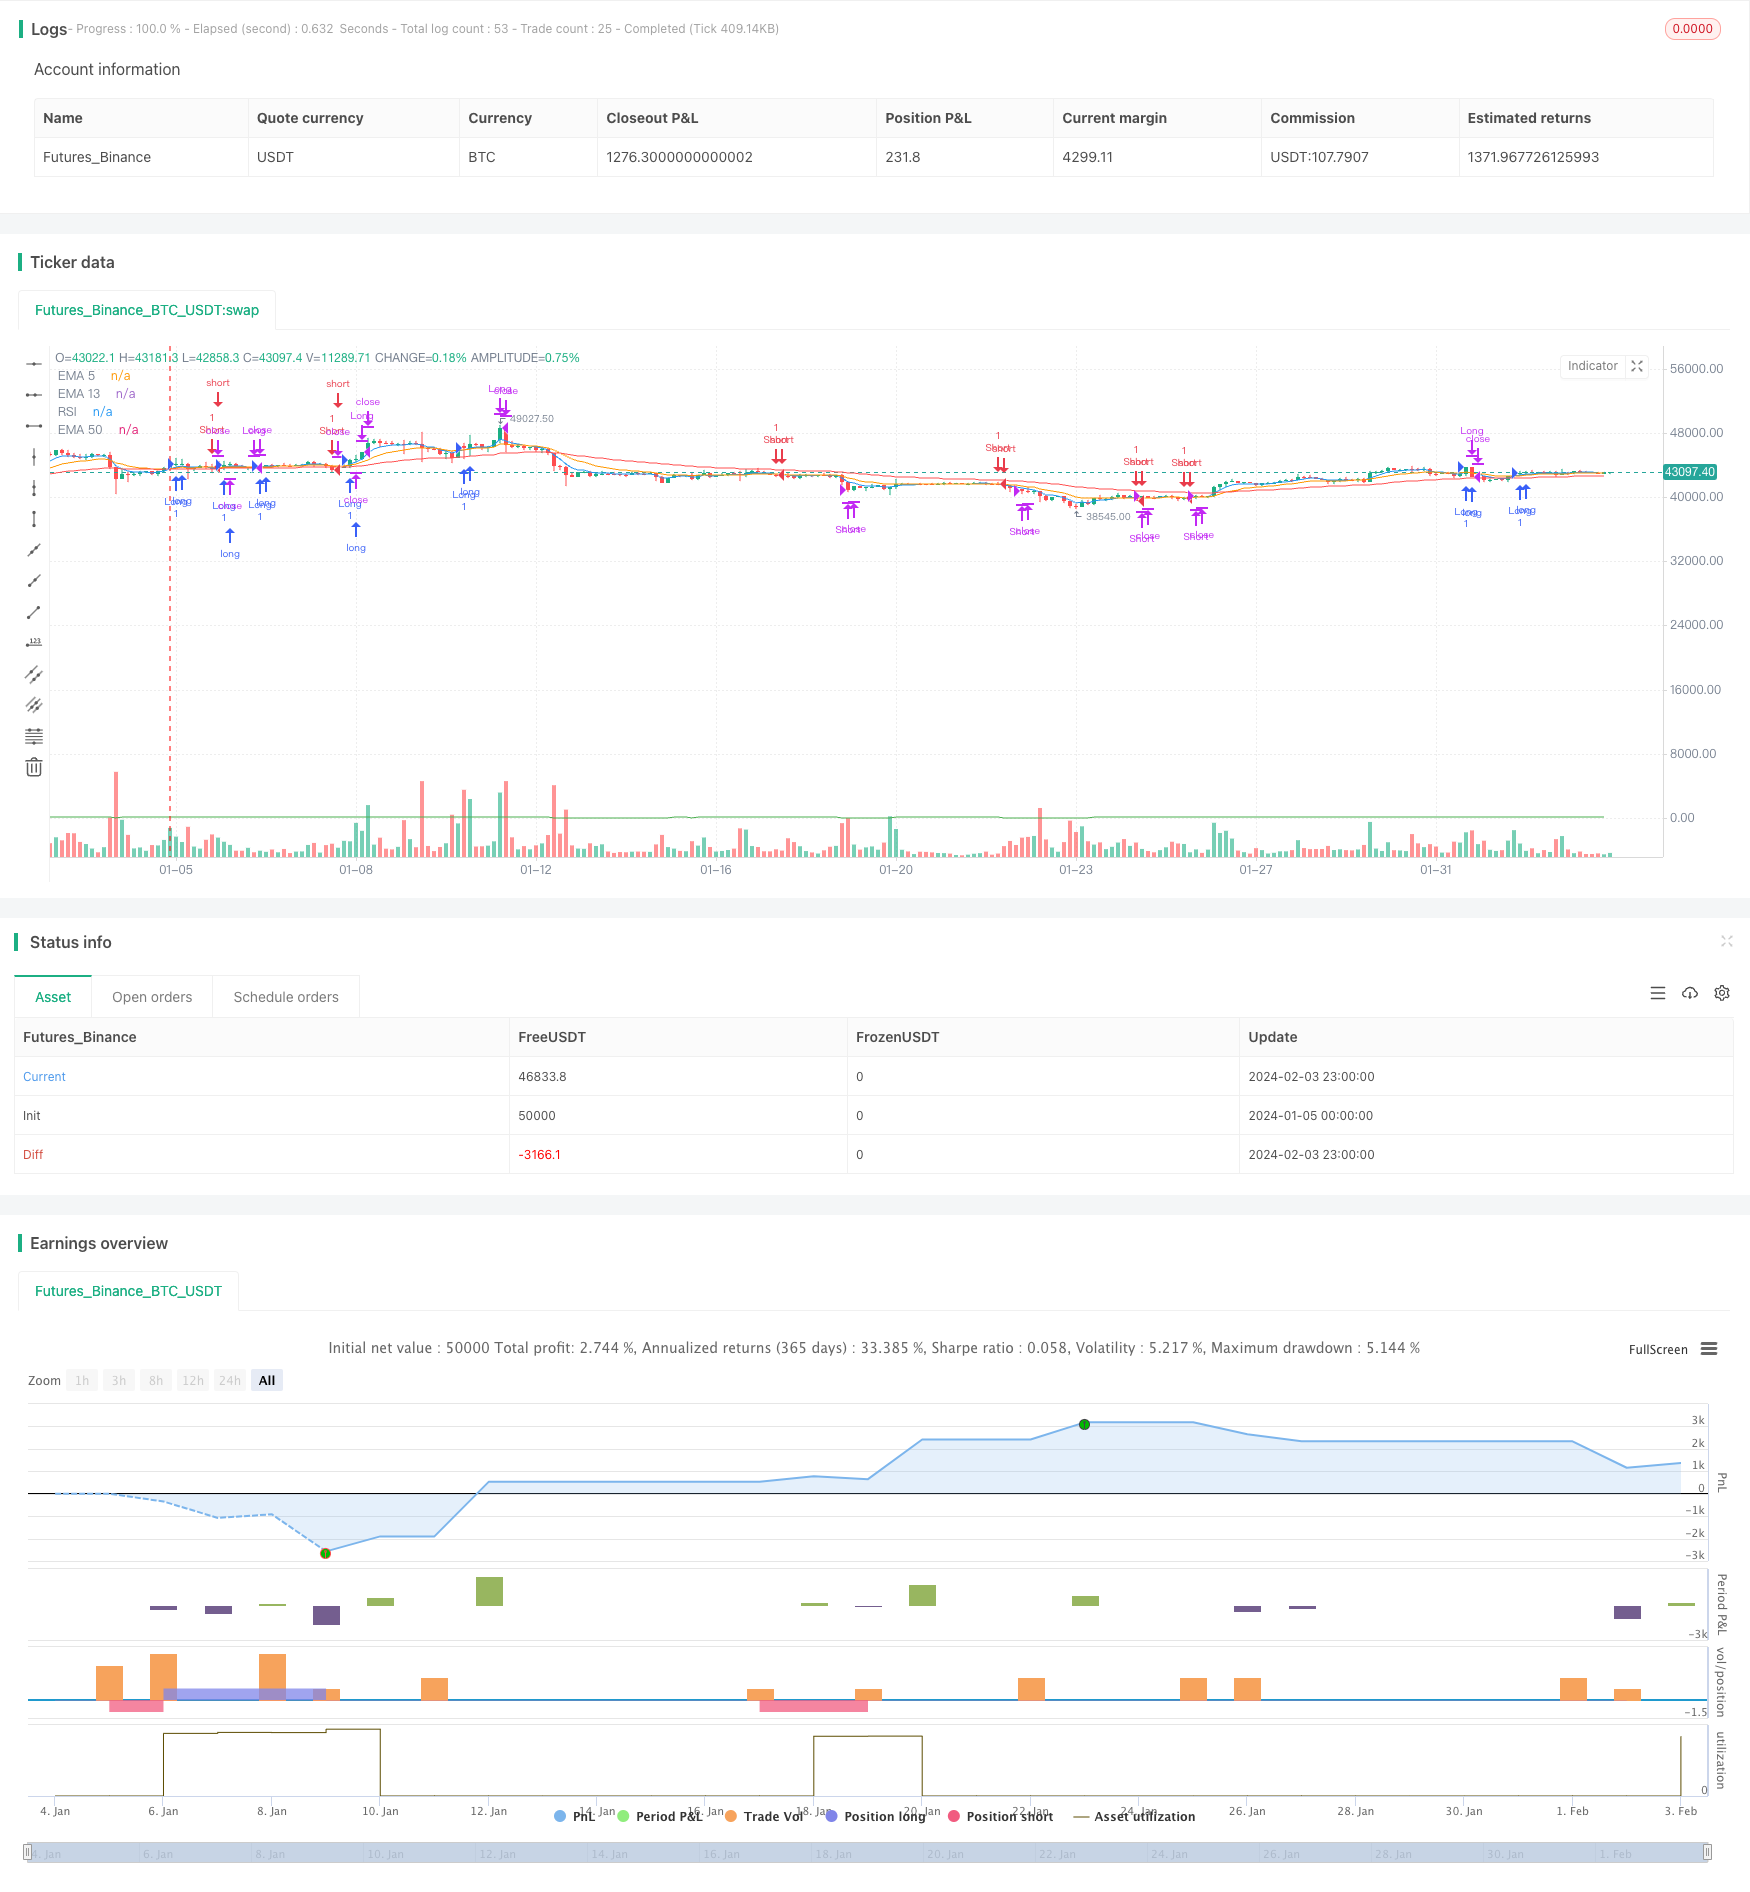
Exponential Moving Average and Relative Strength Index Combination Trend Following Strategy
Author: ChaoZhang, Date: 2024-02-05 09:57:16Tags:

Overview
This strategy combines the EMA and RSI indicators to identify trend direction and enter positions after trend confirmation, avoiding overbuying and overselling by incorporating the RSI indicator. The strategy is simple and practical for medium to long term trend trading.
Strategy Logic
The strategy utilizes the 5-day EMA, 13-day EMA and 50-day EMA moving averages. When the 5-day EMA crosses above the 13-day EMA, it is viewed as a profit opportunity to go long. When the 5-day EMA crosses below the 13-day EMA, it is viewed as a stop loss opportunity to go short. In addition, long positions can only be opened when the price is above the 50-day EMA, and short positions can be opened only when the price is below the 50-day EMA, ensuring the trading direction is consistent with the major trend.
After entering a position, if the RSI becomes overbought (above 70) or the 5-day EMA crosses back below the 13-day EMA, long positions will be closed for profit taking. If the RSI becomes oversold (below 30) or the 5-day EMA crosses back above the 13-day EMA, short positions will be closed for profit.
Advantage Analysis
This strategy combines trend following signals and overbought/oversold indications, which can effectively capture profit opportunities along the main trend direction while avoiding being trapped in range-bound markets. The smoothness of EMAs helps reduce false signals. Also, the RSI settings prevent chasing gains and cutting losses excessively before trend reversals.
Risk Analysis
The strategy relies mainly on moving averages, which can generate more closing signals in winding consolidation markets, failing to hold longer-term positions. If a trend reversal occurs, the trader may not be able to follow the new opportunity promptly. In addition, the parameters of moving averages and RSI can impact strategy performance.
Risks can be reduced by loosening holding conditions, optimizing parameter combinations, incorporating more indicators, etc.
Optimization Directions
The strategy can be optimized in the following aspects:
Add position sizing mechanisms like fixed percentage to control single trade risk.
Optimize EMA and RSI parameters to find the best combination, testing more cycle lengths.
Incorporate more indicators like BO IntegerField to determine trends and reversals based on more factors.
Add automatic stop loss price setting.
Conclusion
The strategy is simple and practical overall. The use of only EMA and RSI requires less parameter optimization and market judgment, making it easy to grasp and backtest. However, flexibility and robustness may be slightly compromised, requiring further enhancements to adapt to more complex market environments. Still, for medium to long term trend trading, it provides a sound approach.
/*backtest
start: 2024-01-05 00:00:00
end: 2024-02-04 00:00:00
period: 3h
basePeriod: 15m
exchanges: [{"eid":"Futures_Binance","currency":"BTC_USDT"}]
*/

//@version=5
strategy("EMA, RSI, and Price Crossover Strategy", overlay=true, default_qty_value = 1)

// Define the EMA lengths
ema5 = ta.ema(close, 5)
ema13 = ta.ema(close, 13)
ema50 = ta.ema(close, 50)

// Define the RSI length
rsiLength = input(14, title="RSI Length")
rsi = ta.rsi(close, rsiLength)

// Define the conditions for long and short positions
longCondition = ta.crossover(ema5, ema13) and close > ema50
shortCondition = ta.crossunder(ema5, ema13) and close < ema50

// Execute long and short positions
if (longCondition)
    strategy.entry("Long", strategy.long)
if (shortCondition)
    strategy.entry("Short", strategy.short)

// Define the exit conditions
exitLongCondition = rsi > 70 or ta.crossunder(ema5, ema13)
exitShortCondition = rsi < 30 or ta.crossover(ema5, ema13)

// Exit long and short positions
if (exitLongCondition)
    strategy.close("Long")
if (exitShortCondition)
    strategy.close("Short")

// Plot EMAs on the chart
plot(ema5, color=color.blue, title="EMA 5")
plot(ema13, color=color.orange, title="EMA 13")
plot(ema50, color=color.red, title="EMA 50")

// Create a separate panel for RSI
rsiPanel = plot(rsi, color=color.green, title="RSI")
- Bollinger Band Momentum Breakout Trading Strategy
- Quantitative Trading Strategy Based on 5-day Moving Average Band and GBS Buy/Sell Signals
- Dual Moving Average Oscillator Stock Strategy
- Momentum Swing Trading Strategy
- Dynamic PSAR Stock Fluctuation Tracking Strategy
- Closing Price Comparison Dual Moving Average Crossover Strategy
- Ichimoku Cloud, MACD and Stochastic Based Multi-Timeframe Trend Tracking Strategy
- MACD Volume Reversal Trading Strategy
- Dynamic Moving Average Crossover Combo Strategy
- Willy Wonka Breakout Strategy
- Reversal Trend Catching and Dynamic Stop Loss Combo Strategy
- Golden Parabola Breakout Strategy
- SAR Momentum Reversal Tracking Strategy
- Dynamic RSI Trading Strategy
- Crossover Strategy between Multiple Moving Averages
- Dual Moving Average Breakout Strategy
- Moving Average Crossover Strategy
- Dual Moving Average Trend Tracking Strategy
- Quadratic Momentum Double Indicators Timing Strategy
- Renko and Relative Vigor Index Trend Following Strategy