Dual Moving Average Tracking Stop Loss Strategy
Author: ChaoZhang, Date: 2024-02-05 13:45:51Tags:

Overview
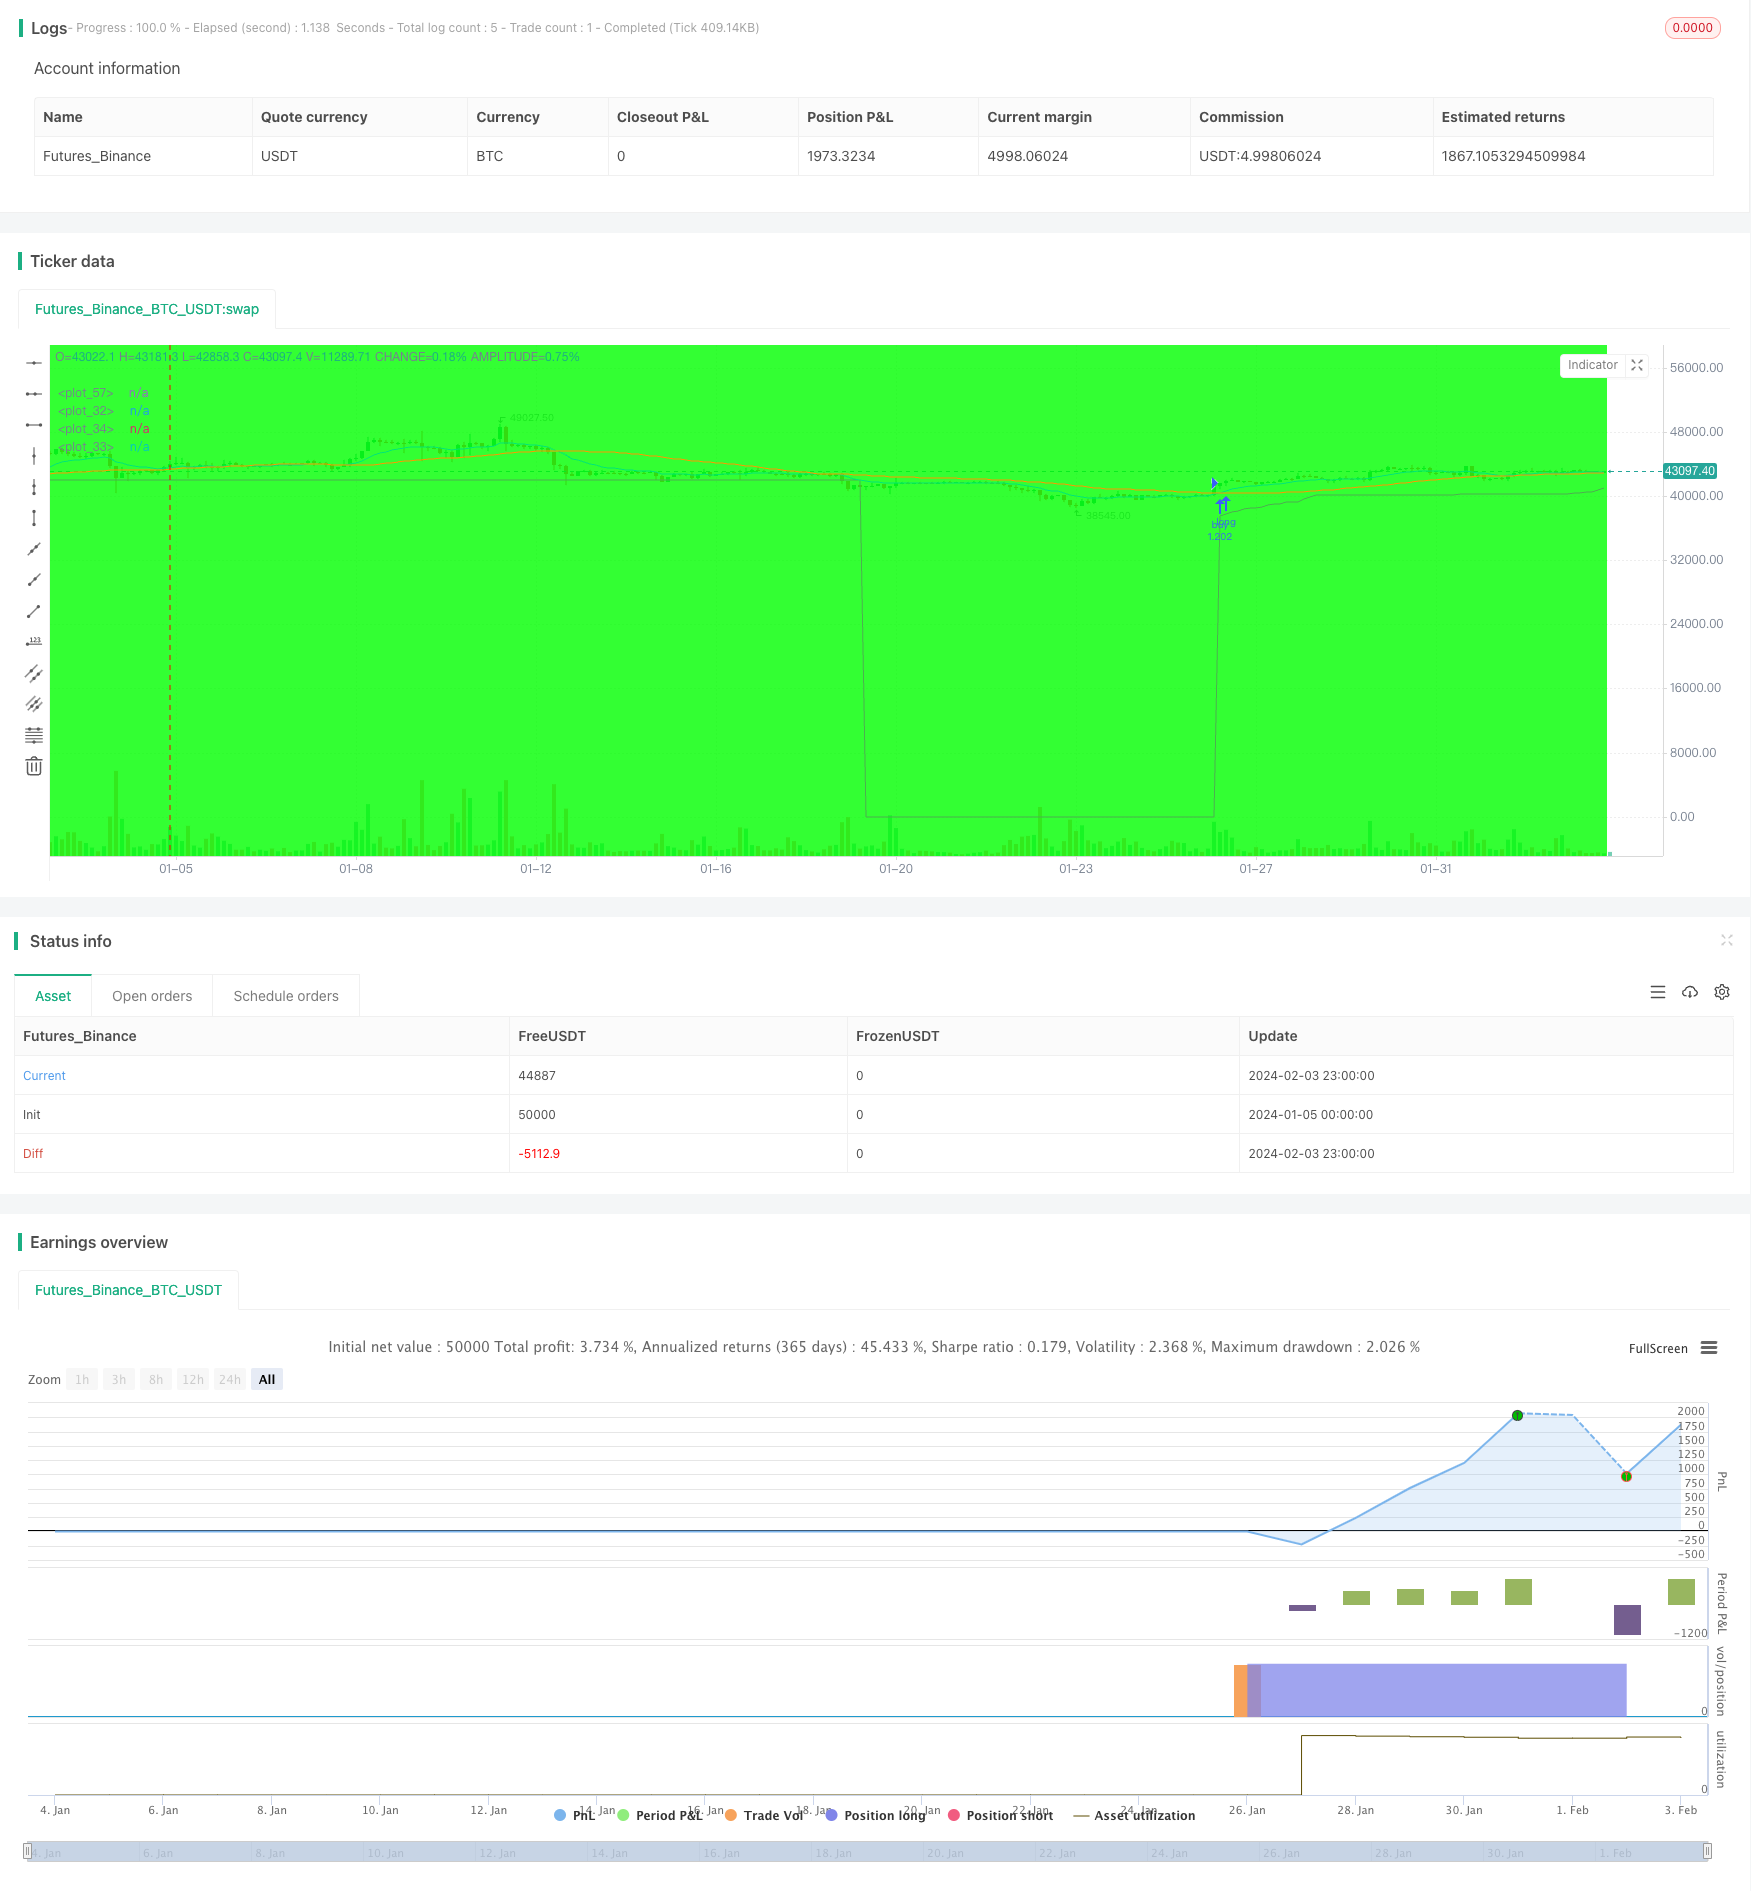
This strategy generates buy signals when the fast moving average crosses over the slow moving average. At the same time, it calculates the trailing stop loss price based on Average True Range to set sell signals. This strategy can effectively track market trends and cut losses in a timely manner when profit-taking.
Principles
- Fast Moving Average (EMA): 12-day Exponential Moving Average that responds quickly to price changes.
- Slow Moving Average (SMA): 45-day Simple Moving Average that depicts medium to long term trends.
- Buy signals are generated when the fast MA crosses over the slow MA.
- The 15-day Average True Range (ATR) is calculated as the benchmark for stop loss.
- Set the trailing stop loss amplitude based on ATR (e.g. 6 x ATR) and update stop price in real time.
- Sell signals are generated when price drops below the stop loss price.
This strategy combines the advantages of trend following and stop loss management. It can track medium to long term trends and control single trade loss through stop loss.
Advantage Analysis
- MA combos effectively identify trends and increase signal reliability.
- Dynamic trailing stop loss timely stops loss to avoid fund damages.
- ATR-based stop loss makes stop price reasonable and prevents oversensitivity.
- The strategy logic is simple and parameters are flexible.
Risk Analysis
- MAs have lags that may miss short-term chances.
- Excessive loose stop loss undermines profitability.
- Excessive tight stop loss increases trade frequency and commission fees.
- Changing volatility may influence ATR parameter stability.
Parameters can be optimized to balance stop loss amplitude. Other indicators can also be combined to improve entry timing.
Optimization Directions
- Test more parameter combinations to find the optimal MAs.
- Adjust ATR multiplier according to specific stock characteristics.
- Add filtering conditions like volume indicators to avoid unnecessary trades.
- Accumulate more historical data to test parameter stability.
Conclusion
This strategy successfully combines MA’s trend following ability and ATR’s dynamic trailing stop loss. Parameters can be optimized to adapt to different stocks. It forms clear buy and sell boundaries, making logic simple and clear. In conclusion, this dual MA tracking stop loss strategy features stability, simplicity and ease of optimization. It works well as a fundamental strategy for stock trading.
/*backtest
start: 2024-01-05 00:00:00
end: 2024-02-04 00:00:00
period: 3h
basePeriod: 15m
exchanges: [{"eid":"Futures_Binance","currency":"BTC_USDT"}]
*/

//@version=2
//created by XPloRR 24-02-2018

strategy("XPloRR MA-Buy ATR-MA-Trailing-Stop Strategy",overlay=true, initial_capital=1000,default_qty_type=strategy.percent_of_equity,default_qty_value=100)

testStartYear = input(2005, "Start Year")
testStartMonth = input(1, "Start Month")
testStartDay = input(1, "Start Day")
testPeriodStart = timestamp(testStartYear,testStartMonth,testStartDay,0,0)

testStopYear = input(2050, "Stop Year")
testStopMonth = input(12, "Stop Month")
testStopDay = input(31, "Stop Day")
testPeriodStop = timestamp(testStopYear,testStopMonth,testStopDay,0,0)

testPeriodBackground = input(title="Background", type=bool, defval=true)
testPeriodBackgroundColor = testPeriodBackground and (time >= testPeriodStart) and (time <= testPeriodStop) ? #00FF00 : na
bgcolor(testPeriodBackgroundColor, transp=97)

emaPeriod = input(12, "Exponential MA")
smaPeriod = input(45, "Simple MA")
stopPeriod = input(12, "Stop EMA")
delta = input(6, "Trailing Stop #ATR")

testPeriod() => true

emaval=ema(close,emaPeriod)
smaval=sma(close,smaPeriod)
stopval=ema(close,stopPeriod)
atr=sma((high-low),15)

plot(emaval, color=blue,linewidth=1)
plot(smaval, color=orange,linewidth=1)
plot(stopval, color=lime,linewidth=1)

long=crossover(emaval,smaval)
short=crossunder(emaval,smaval)

//buy-sell signal
stop=0
inlong=0
if testPeriod()
    if (long and (not inlong[1]))
        strategy.entry("buy",strategy.long)
        inlong:=1
        stop:=emaval-delta*atr
    else
        stop:=iff((nz(emaval)>(nz(stop[1])+delta*atr))and(inlong[1]),emaval-delta*atr,nz(stop[1]))
        inlong:=nz(inlong[1])
        if ((stopval<stop) and (inlong[1]))
            strategy.close("buy")
            inlong:=0
            stop:=0
else
    inlong:=0
    stop:=0
plot(stop,color=green,linewidth=1)
- Camarilla Pivot Points Strategy Based on Bollinger Bands
- Trend Following Strategy Based on EMA Lines
- Dynamic Envelope Moving Average Strategy
- Moving Average Crossover Trend Following Strategy
- Stepwise Pyramiding Moving Average Breakout Strategy
- Bollinger Bands Dual-track Breakthrough Strategy
- Future Lines of Demarcation Backtest Strategy
- Quant Trading Strategy Based on SuperTrend Channel
- Profit rate theory volatility index quantification strategy
- Relative Strength Index Long-term Quant Strategy
- RSI and WMA Crossover Strategy
- Dynamic SMA Cross Trend Strategy
- Dual MA Indicator Oscillating Price Tracking Strategy
- Dual Moving Average Supertrend Quantitative Trading Strategy
- Trend Following Quant Strategy Based on Hull and LSMA Indicators
- Moving Average and RSI Crossover Strategy
- Dual Range Filter Trend Tracking Strategy
- Super Trend Following Strategy Based on Moving Averages
- Engulfing Candle RSI Trading Strategy
- A Bollinger Band and Trend Tracking Strategy Based on RSI