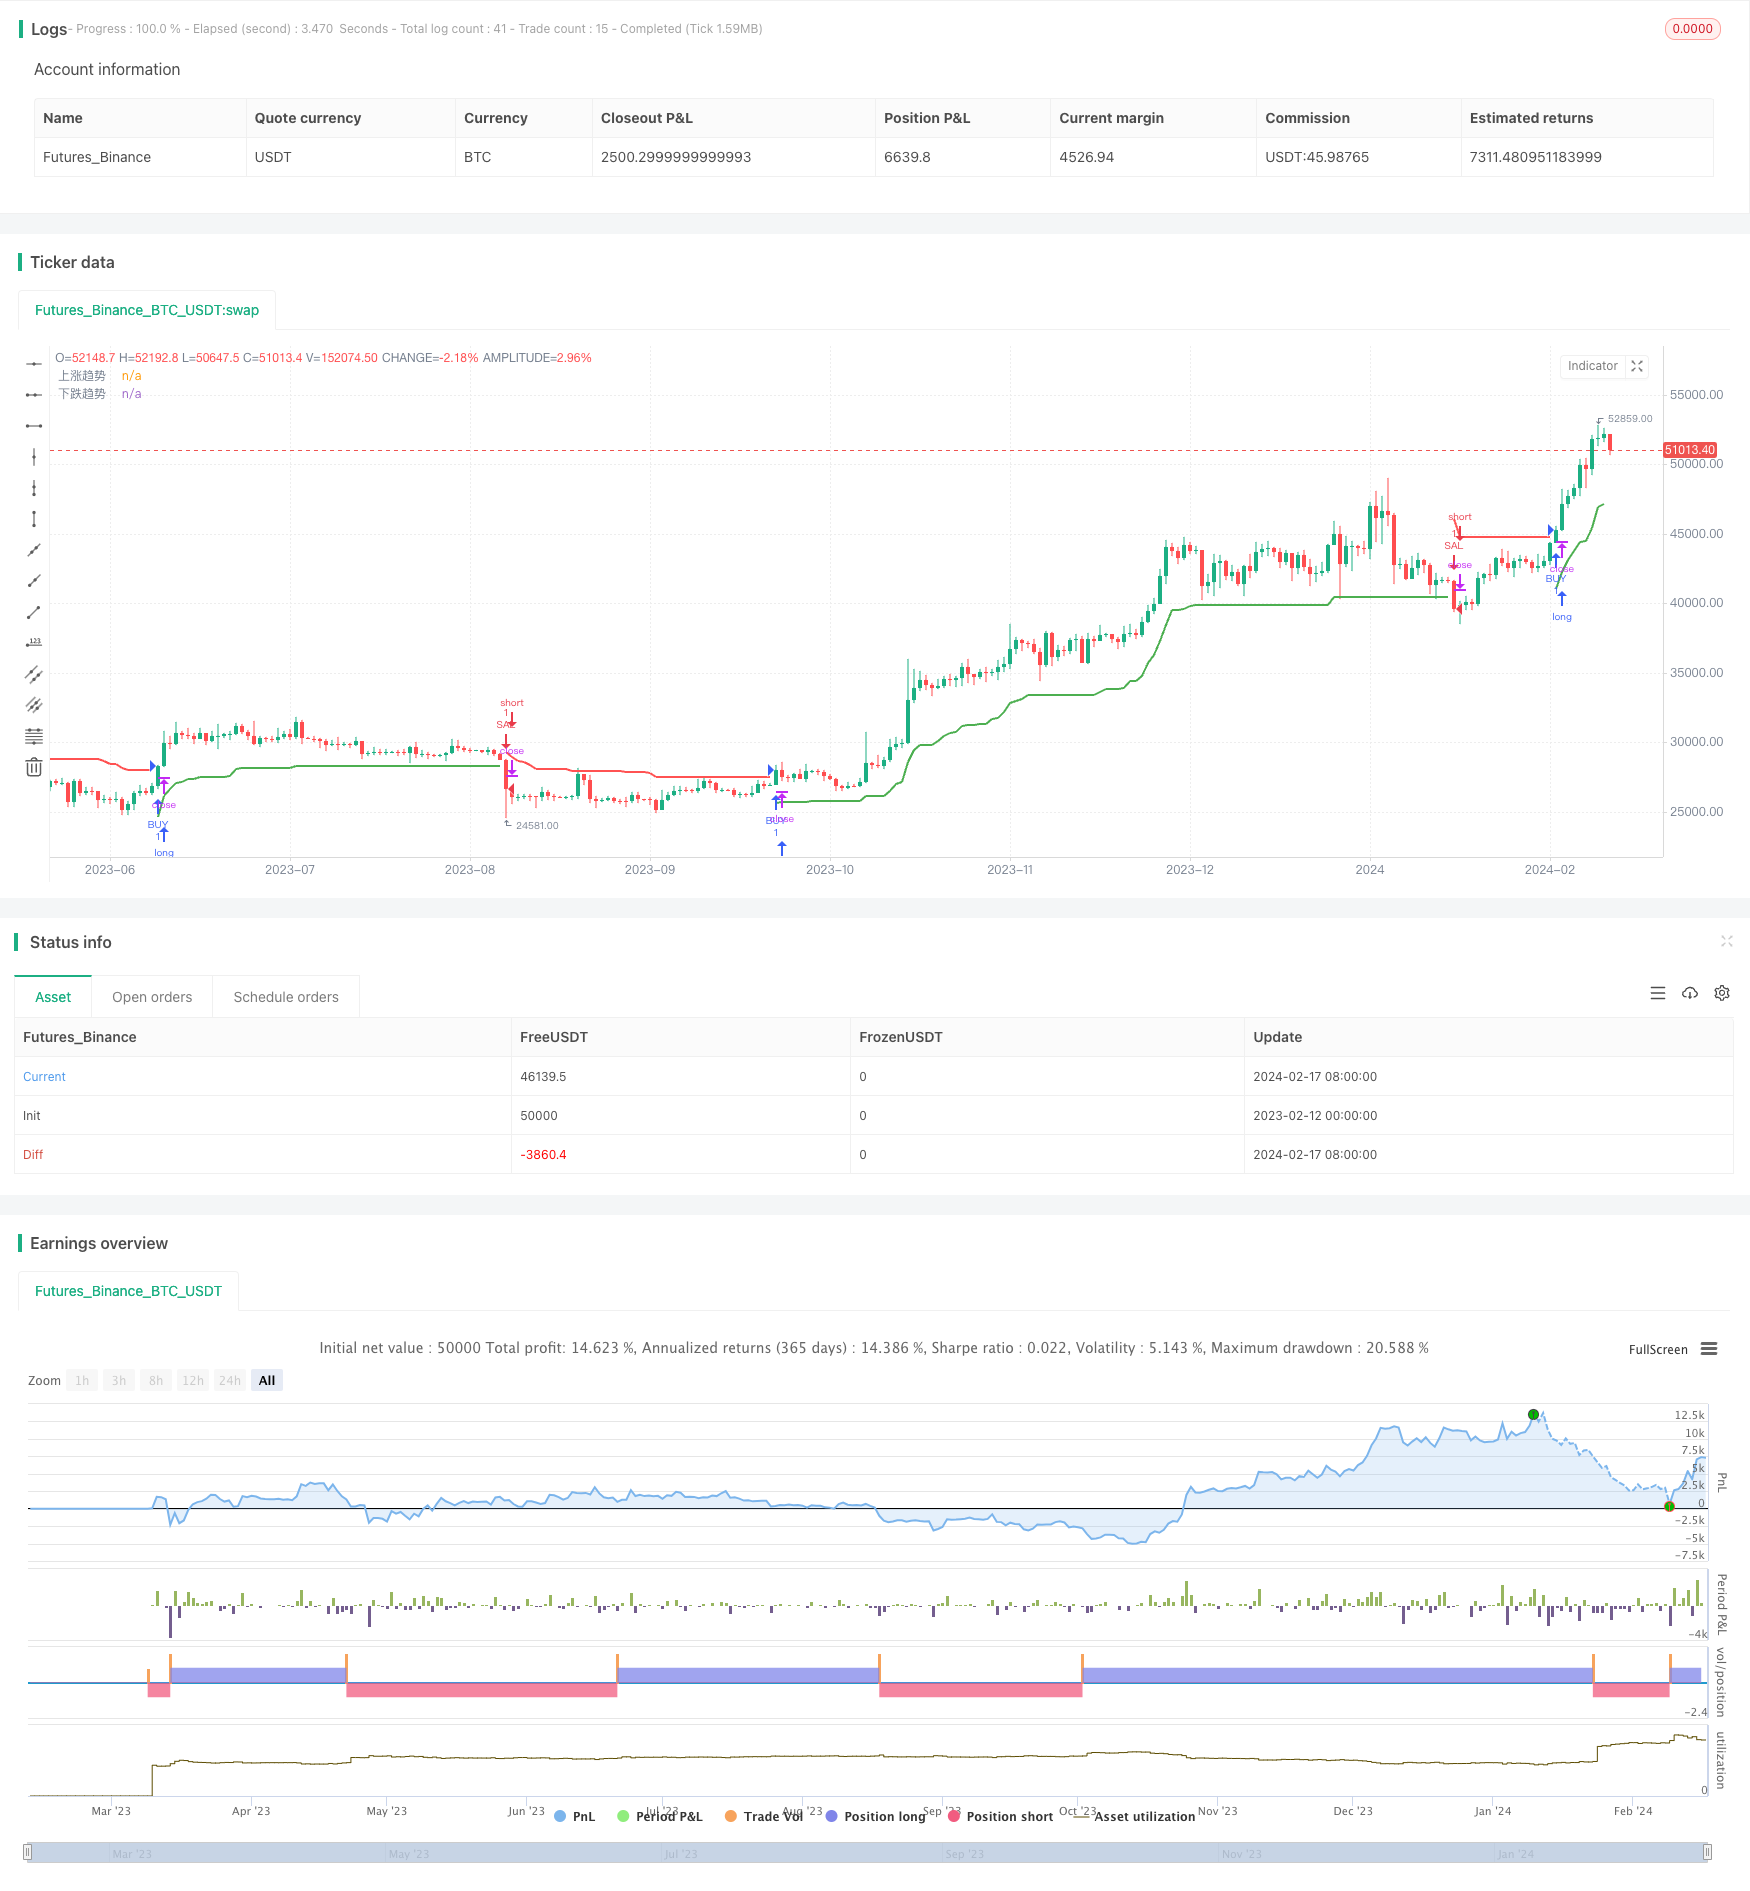
Overview
The Super ATR Trend Following Strategy is an ATR indicator based trend following strategy. It uses the ATR indicator to measure market volatility and sets stop loss based on multiple ATRs to track trends.
Strategy Logic
The strategy first calculates the ATR indicator, which is the moving average of the price volatility over the past N days, to represent market risk and volatility. The strategy allows us to change the ATR calculation method, either regular ATR or SMA.
Then the upper and lower bands are calculated based on ATR value multiplied by a factor, ie: close - Multiplier * ATR for upper band; close + Multiplier * ATR for lower band. This forms an ATR based trend channel.
We then judge if the current price breaks through the upper or lower band of the channel. If price breaks through the upper band, it is judged as entering a downtrend; if price breaks through the lower band, it is judged as entering an uptrend. When there is a trend breakout, we make the corresponding buy and sell.
In addition, the strategy has set a trading time window to only trade in the specified date time range.
Advantage Analysis
This indicator channel based trend following strategy has the following advantages:
- Using ATR indicator to automatically adjust stop loss position effectively controls risks
- ATR considers price volatility, more reasonable stop loss
- Increase entry precision by channel breakout
- Allows adjustment of ATR calculation method, more flexible
- Setting trading window avoids strategy failure during significant events
In general, this is a simple and practical trend following strategy that can effectively control risks and obtain good returns.
Risk Analysis
There are also some risks to this strategy:
- Market may have violent changes that ATR fails to react timely, resulting in too loose stop loss
- Price may range in channel when sentiment diverges, increasing trading risk
- Fixed multiple may not suit all products, needs adjustment accordingly
- setWindow limits trading opportunities, may miss good trades if not set properly
To control these risks, we can take the following measures:
- Combine other indicators to determine market condition, avoid solely relying on ATR
- Add filters to avoid invalid breakout introducing trade risk
- Select proper multiplier according to historical characteristics of different products
- Optimize and test setWindow parameters to ensure proper setup
Optimization
There is room for further optimization of this strategy:
- Introduce machine learning algorithms to dynamically optimize multiplier
- Incorporate sentiment indicators etc to optimize channel range
- Add volume or volatility confirmation to avoid invalid breakout
- Utilize advanced time based strategy framework for backtest
These optimizations can further improve the stability and profitability of the strategy.
Conclusion
Overall this is a very practical trend following strategy. It builds an adaptive channel using ATR indicator and determines entries by channel breakouts. The strategy is simple and effective to control risks, suitable for tracking mid-long term trends. We also proposed further risk control and optimization suggestions to make the strategy more robust.
/*backtest
start: 2023-02-12 00:00:00
end: 2024-02-18 00:00:00
period: 1d
basePeriod: 1h
exchanges: [{"eid":"Futures_Binance","currency":"BTC_USDT"}]
*/

//@version=5
strategy('B厂长 @超级趋势精简优化版', overlay=true)
Periods = input(title='ATR周期', defval=10)
src = input(hl2, title='价格数据源')
Multiplier = input.float(title='ATR 乘数', step=0.1, defval=3.0)
changeATR = input(title='更改ATR计算方法', defval=true,tooltip = '默认为art否则sma(ta.tr,ATR周期)')
showsignals = input(title='显示买入/卖出信号', defval=false)
atr2 = ta.sma(ta.tr, Periods)
atr = changeATR ? ta.atr(Periods) : atr2
up = src - Multiplier * atr
up1 = nz(up[1], up)
up := close[1] > up1 ? math.max(up, up1) : up
dn = src + Multiplier * atr
dn1 = nz(dn[1], dn)
dn := close[1] < dn1 ? math.min(dn, dn1) : dn
trend = 1
trend := nz(trend[1], trend)
trend := trend == -1 and close > dn1 ? 1 : trend == 1 and close < up1 ? -1 : trend
upPlot = plot(trend == 1 ? up : na, title='上涨趋势', style=plot.style_linebr, linewidth=2, color=color.new(color.green, 0))
buySignal = trend == 1 and trend[1] == -1
plotshape(buySignal and showsignals ? up : na, title='买点', text='买点', location=location.absolute, style=shape.labelup, size=size.tiny, color=color.new(color.green, 0), textcolor=color.new(color.white, 0))
dnPlot = plot(trend == 1 ? na : dn, title='下跌趋势', style=plot.style_linebr, linewidth=2, color=color.new(color.red, 0))
sellSignal = trend == -1 and trend[1] == 1
plotshape(sellSignal and showsignals ? dn : na, title='卖点', text='卖点', location=location.absolute, style=shape.labeldown, size=size.tiny, color=color.new(color.red, 0), textcolor=color.new(color.white, 0))
FromMonth = input.int(defval=9, title='From Month', minval=1, maxval=12)
FromDay = input.int(defval=1, title='From Day', minval=1, maxval=31)
FromYear = input.int(defval=2018, title='From Year', minval=999)
ToMonth = input.int(defval=1, title='To Month', minval=1, maxval=12)
ToDay = input.int(defval=1, title='To Day', minval=1, maxval=31)
ToYear = input.int(defval=9999, title='To Year', minval=999)
start = timestamp(FromYear, FromMonth, FromDay, 00, 00)
finish = timestamp(ToYear, ToMonth, ToDay, 23, 59)
window() =>
    time >= start and time <= finish ? true : false
longCondition = buySignal
if longCondition and window()
    strategy.entry('BUY', strategy.long, comment = '做多')
shortCondition = sellSignal
if shortCondition and window()
    strategy.entry('SAL', strategy.short, comment = '做空')

buy1 = ta.barssince(buySignal)
sell1 = ta.barssince(sellSignal)
color1 = buy1[1] < sell1[1] ? color.green : buy1[1] > sell1[1] ? color.red : na