Supertrend and Moving Average Crossover Strategy
Author: ChaoZhang, Date: 2024-02-19 11:56:52Tags:

Overview
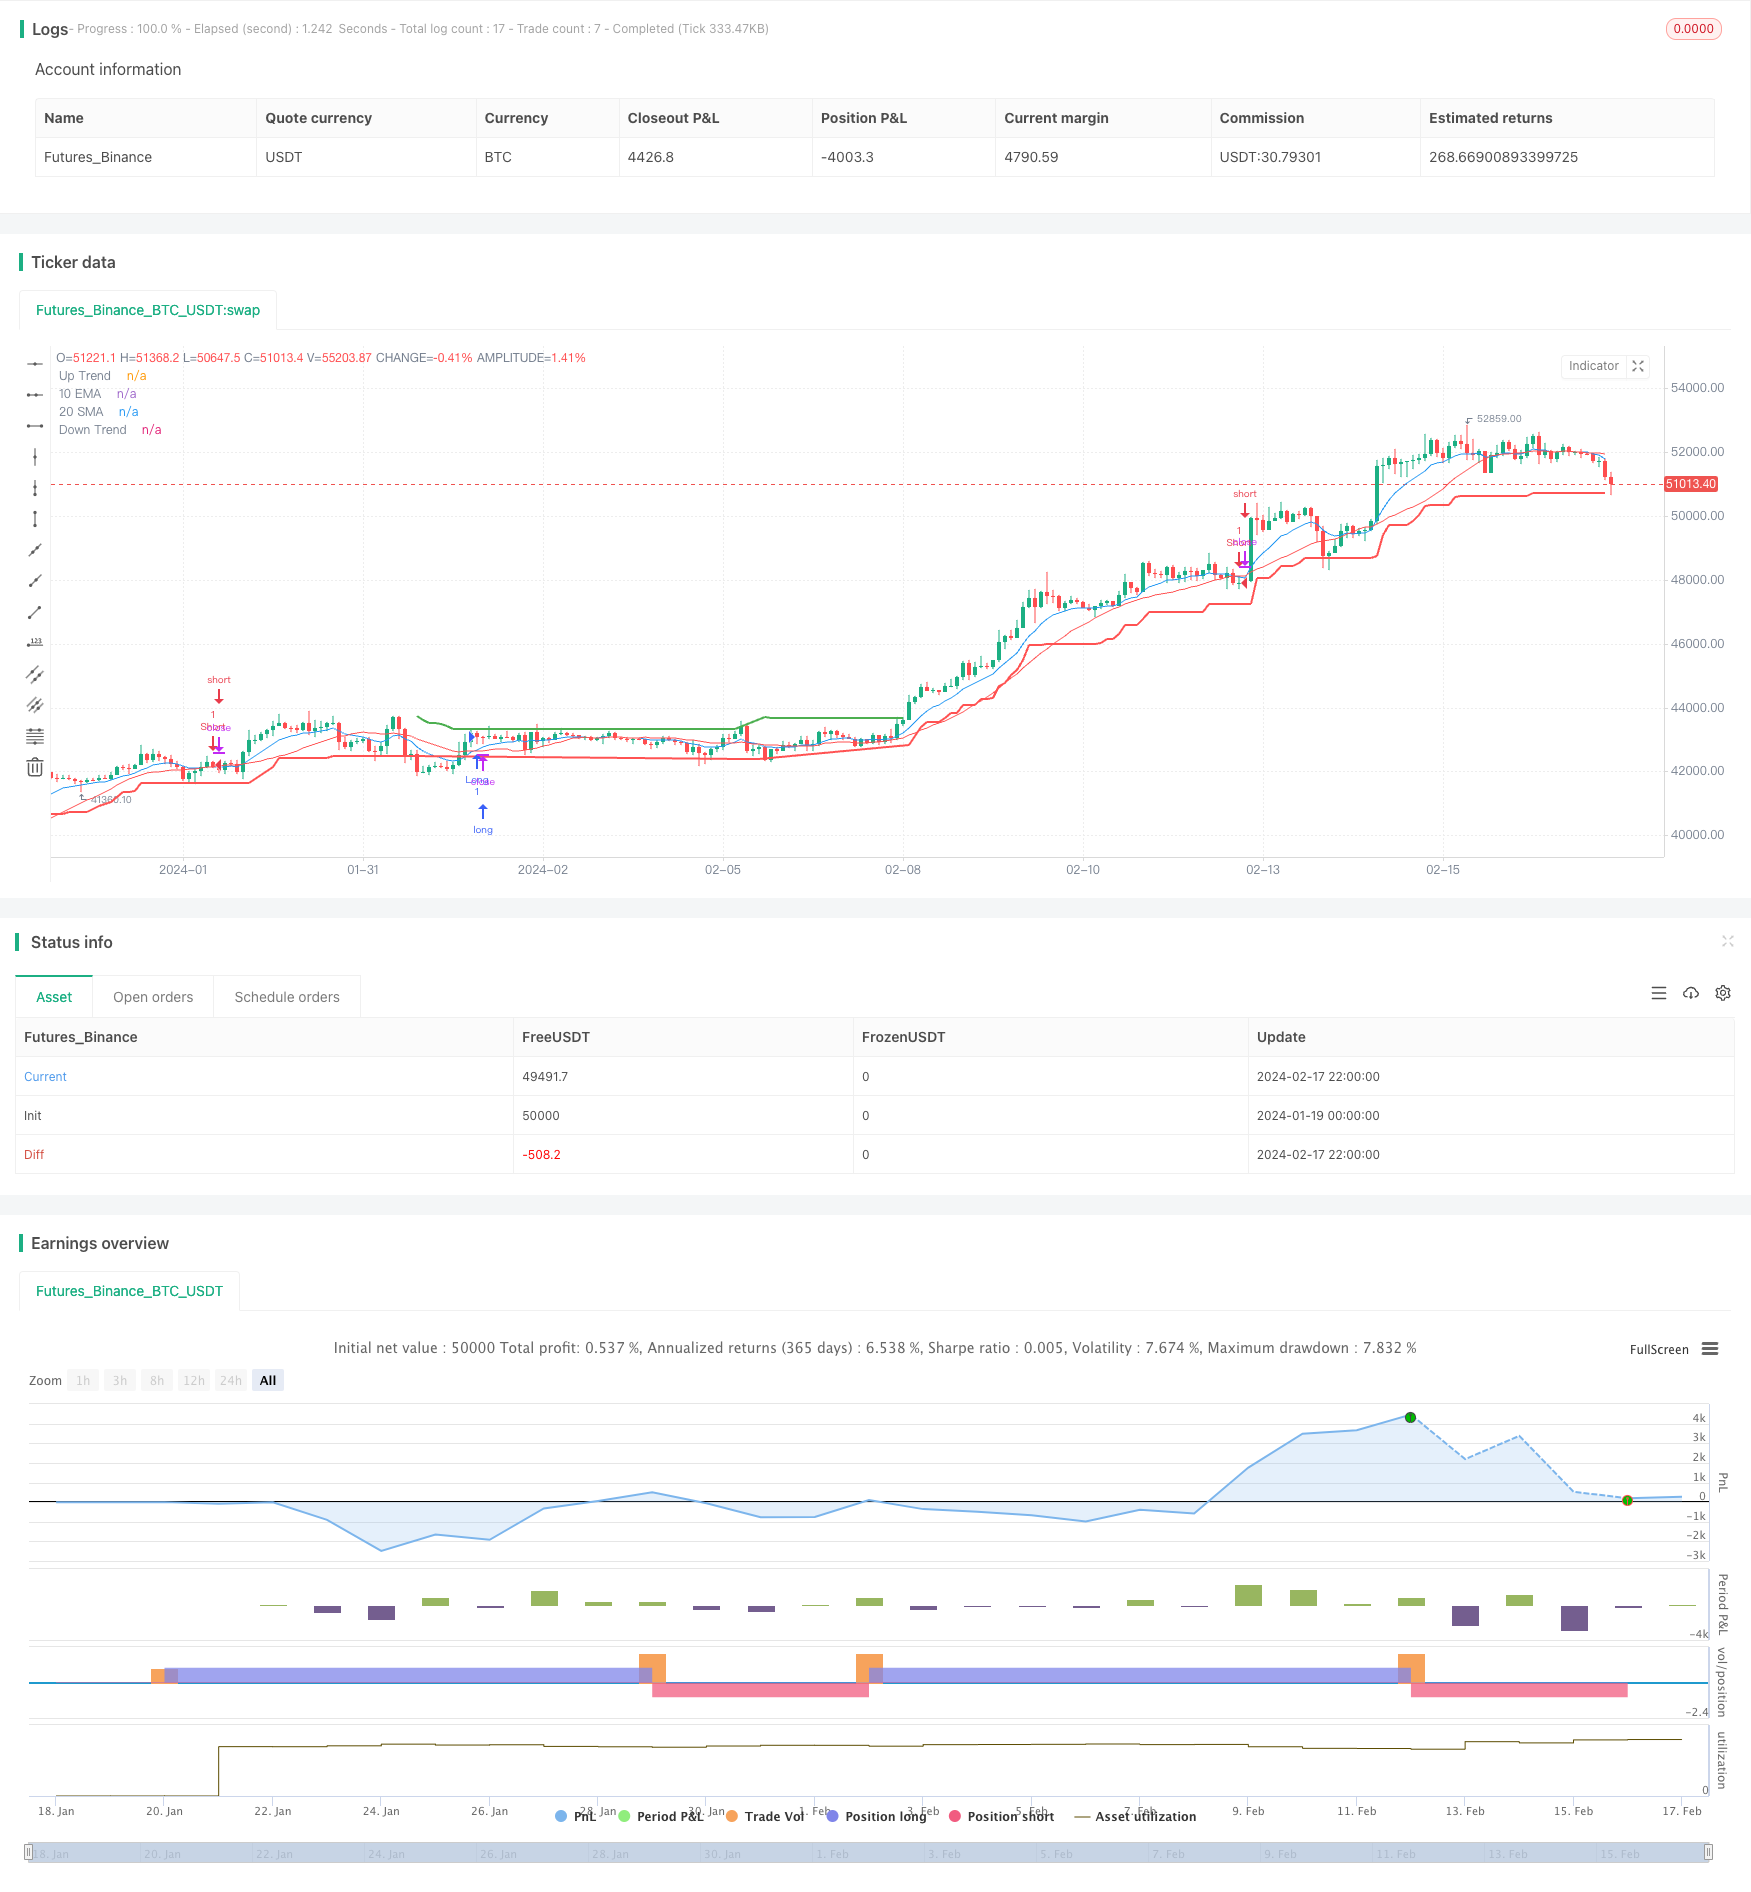
The strategy is named “Supertrend and Moving Average Crossover Strategy”. It combines the Supertrend indicator and moving averages, going long when the supertrend indicates an uptrend and 10-day EMA is above 20-day SMA, and going short when the supertrend indicates a downtrend and 10-day EMA is below 20-day SMA. It’s a typical trend following strategy.
Strategy Logic
The strategy uses the Supertrend indicator to determine the market trend direction. Supertrend is calculated based on Average True Range and a Factor. When the price is above Supertrend line, it’s an uptrend; when the price is below Supertrend line, it’s a downtrend. In this strategy, the Factor is set to 3.0 and ATR length is 10.
In addition, the strategy uses 10-day EMA and 20-day SMA to construct moving averages. EMA (Exponential Moving Average) assigns higher weight to recent prices, while SMA (Simple Moving Average) considers all data with equal weight. When the shorter-term EMA is above the longer-term SMA, it’s considered a buy signal.
In summary, the trade signal generation logic is:
Long entry: Supertrend > 0 (uptrend) AND 10-day EMA > 20-day SMA Short entry: Supertrend < 0 (downtrend) AND 10-day EMA < 20-day SMA
So it determines the trend direction with Supertrend and uses the moving average crossover for additional confirmation, to construct this trend following strategy.
Advantage Analysis
The biggest advantage of this strategy is combining Supertrend and moving averages, which improves both reliability and sensitivity. The main advantages are:
- Supertrend clearly identifies the main trend, reducing false signals
- EMA+SMA crossover improves sensitivity to trend changes
- Judging multiple factors improves reliability
- Simple and clear indicators, easy to understand and optimize
- High flexibility to adjust parameters of Supertrend and MAs
Risk Analysis
There are some risks in this strategy:
- Improper Supertrend parameters may miss turn points
- Improper MA parameters may generate false signals
- Improper backtest period selection may overestimate performance
- No consideration of trading costs
We can test different ATR and Factor values for Supertrend, and different length values for MAs. Also the backtest period should cover different market environments. Trading costs should be added in live trading.
Optimization Directions
There is large room for optimization:
- Adjust ATR length and Factor in Supertrend
- Adjust length of EMA and SMA
- Add other indicators like RSI, MACD for signal filtering
- Buy when Supertrend turns up and EMA crosses over SMA after some duration
- Add stop loss strategy
This can further improve performance and stability. Also stop loss configuration is important for risk control.
Conclusion
The strategy combines Supertrend for trend direction and EMA+SMA crossovers to generate signals, a typical trend following system. It has high reliability and much flexibility for optimization, worth verifying in live trading. But we should also control risks and prevent excessive optimization.
/*backtest
start: 2024-01-19 00:00:00
end: 2024-02-18 00:00:00
period: 2h
basePeriod: 15m
exchanges: [{"eid":"Futures_Binance","currency":"BTC_USDT"}]
*/

//@version=5
strategy("Supertrend and Moving Averages Strategy", overlay=true)

// Supertrend parameters
atrLength = input.int(10, title="ATR Length", minval=1)
factor = input.float(3.0, title="Factor", minval=0.01, step=0.01)
[supertrend, direction] = ta.supertrend(factor, atrLength)

// Moving Averages parameters
length_ema = input(10, title="Length of EMA")
length_sma = input(20, title="Length of SMA")

// Calculate EMAs and SMAs
ema_10 = ta.ema(close, length_ema)
sma_20 = ta.sma(close, length_sma)

// Strategy logic
longCondition = ema_10 > sma_20 and direction > 0
shortCondition = ema_10 < sma_20 and direction < 0

strategy.entry("Long", strategy.long, when=longCondition)
strategy.entry("Short", strategy.short, when=shortCondition)

// Plot Supertrend
plot(direction > 0 ? supertrend : na, color=color.green, style=plot.style_line, linewidth=2, title="Up Trend")
plot(direction < 0 ? supertrend : na, color=color.red, style=plot.style_line, linewidth=2, title="Down Trend")

// Plot Moving Averages
plot(ema_10, color=color.blue, title="10 EMA")
plot(sma_20, color=color.red, title="20 SMA")

// Alerts for Supertrend
alertcondition(direction[1] > direction, title='Downtrend to Uptrend', message='The Supertrend value switched from Downtrend to Uptrend ')
alertcondition(direction[1] < direction, title='Uptrend to Downtrend', message='The Supertrend value switched from Uptrend to Downtrend')
alertcondition(direction[1] != direction, title='Trend Change', message='The Supertrend value switched from Uptrend to Downtrend or vice versa')
- Momentum Trend Synergy Strategy
- Rational Trading Robot Powered by RSI Strategy
- DYNAMIC MOMENTUM OSCILLATOR TRAILING STOP STRATEGY
- Bugra Trading Strategy Based on Dual Kinetic Moving Average
- Fractal and Pattern Based Quantitative Trading Strategy
- Reversal Fluctuation CAT Strategy
- Price Channel VWAP Trading Strategy
- The Interwoven Moving Average Crossover Strategy
- Moving Average Breakout and Bollinger Band Breakout Strategy
- Absolute Momentum Indicator Strategy
- Dual Trend Breakout Strategy
- SSL Channel and Wave Trend Quantitative Trading Strategy
- Super ATR Trend Following Strategy
- Trading-oriented Ichimoku Cloud Nine Strategy
- LPB Microcycles Adaptive Oscillation Contour Tracking Strategy
- Best ABCD Pattern Trading Strategy with Stop Loss and Take Profit Tracking
- Major Trend Indicator Long
- Multi Timeframe Strategy
- Dynamic Balancing Leveraged ETF Investment Strategy
- Multi-timeframe MACD Indicator Crossover Trading Strategy