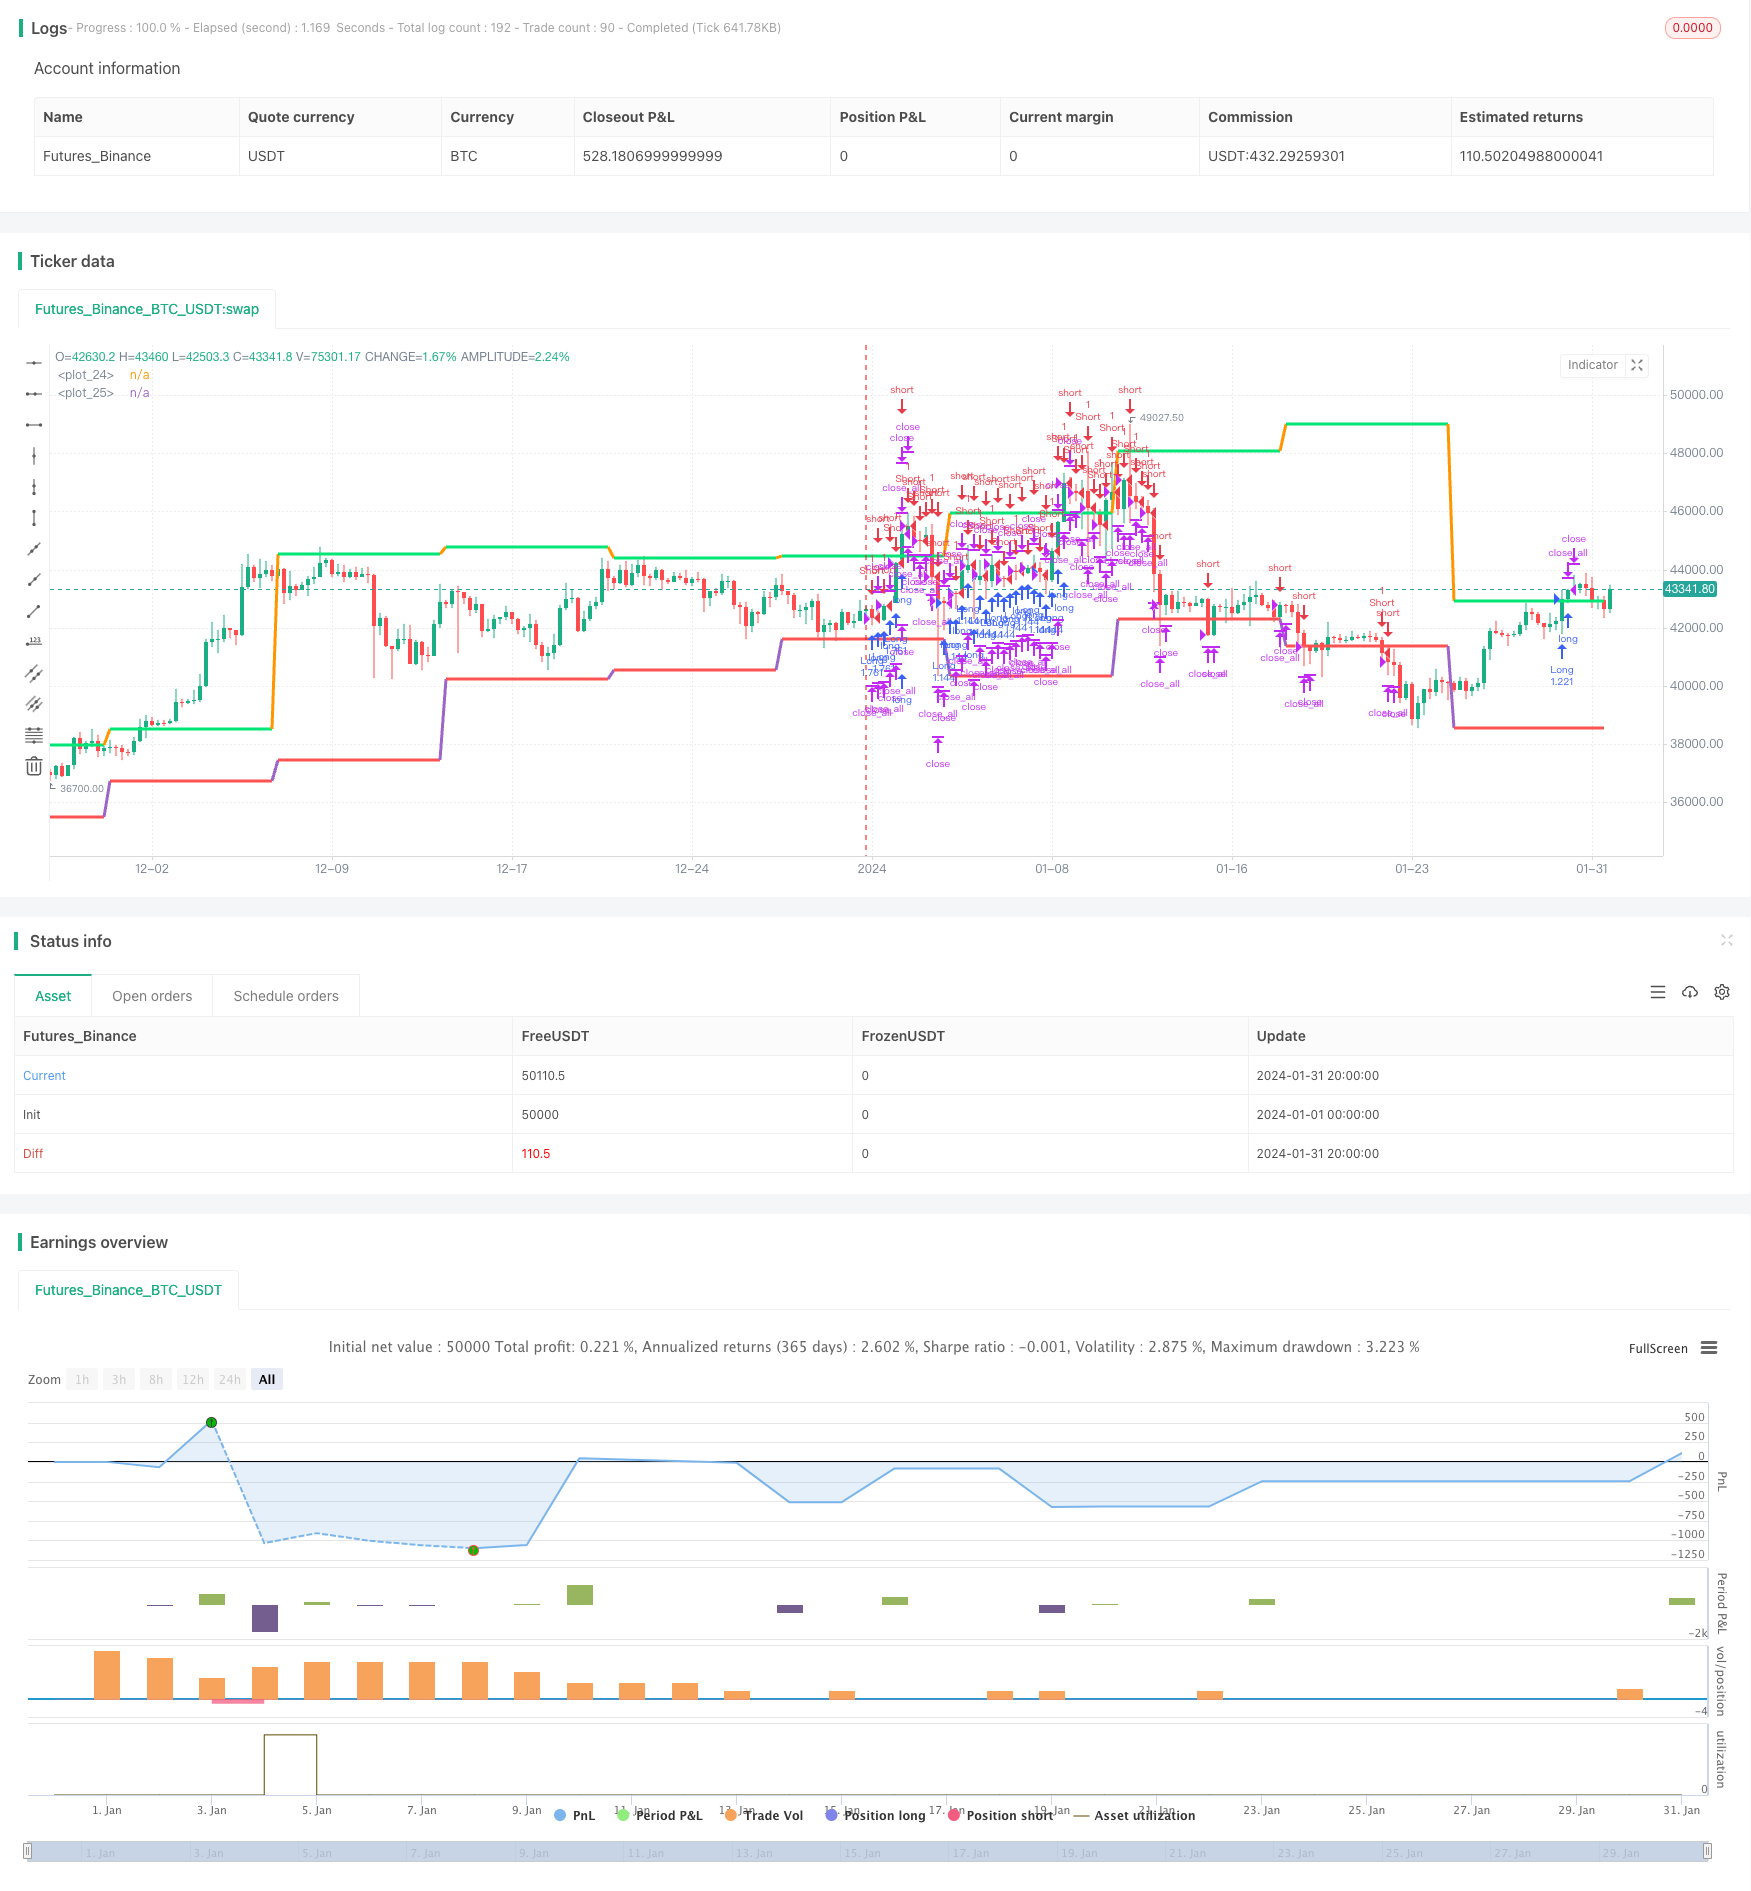
Extremum Reversion Tracking Strategy
Author: ChaoZhang, Date: 2024-02-20 15:17:41Tags:

Overview
The extremum reversion tracking strategy tracks the extremum points of price fluctuation range and makes reversal long/short positions at extremum points to track trends.
Strategy Principle
The strategy is mainly based on the following principles:
Use security function to obtain high and low prices of different cycle K-lines to detect whether they are equal to previous ones, so as to judge if new extremum points are reached.
When new extremum points are detected, make short position if it is currently a bull market, and make long position if it is currently a bear market.
Set stop loss point as the new extremum point formed after long/short position is made to track trends with stop loss.
Set the effective time range of the strategy by configuring start year, month and date to make adjustments for different time periods.
Advantages
The main advantages of this strategy are:
Effectively capture extremum points of price changes and make reversal positions to track trends.
Configure time and risk management to control usage time and capital of the strategy to reduce risks.
Use new extremum points as stop loss points to dynamically adjust stop loss positions based on new price fluctuation range.
Simple and clear strategy logic for easy understanding, debugging and optimization.
Risks
There are also some risks for this strategy:
There could be misjudgement in determining extremum points, causing errors in long/short positions. The logic can be optimized.
Stop loss position is close to entry point, increasing the probability of stop loss being triggered. Floating stop loss can be used.
No consideration on pyramiding positions along trends and reverse positions, less profitable in trending markets. Related logics can be added.
Currency and time range configuration is quite rigid, cannot make dynamic adjustments. Parameter optimization system can be introduced.
Optimization Directions
The strategy can be optimized in the following aspects:
Optimize extremum point logic with more filters to avoid misjudgement.
Add floating stop loss mechanism based on price and volatility changes to adjust stop loss distance.
Introduce pyramiding and reverse position modules based on trends and volatility to improve profitability.
Establish parameter optimization mechanism for automatic testing and parameter tuning.
Incorporate machine learning models to assist strategy decision making.
Summary
The extremum reversion tracking strategy works by capturing price extremums and tracking trends, adaptable and profitable. Further optimizations on extremum judgement, stop loss mechanism, position opening rules etc. could shape it into a solid quantitative trading strategy.
/*backtest
start: 2024-01-01 00:00:00
end: 2024-01-31 23:59:59
period: 6h
basePeriod: 15m
exchanges: [{"eid":"Futures_Binance","currency":"BTC_USDT"}]
*/

//Noro
//2018

//@version=2
strategy(title = "Noro's Extremum Strategy v1.0", shorttitle = "Extremum str 1.0", overlay = true, default_qty_type = strategy.percent_of_equity, default_qty_value = 100, pyramiding = 0)

//Settings
needlong = input(true, defval = true, title = "Long")
needshort = input(false, defval = false, title = "Short")
capital = input(100, defval = 100, minval = 1, maxval = 10000, title = "Capital, %")
tf = input('W', title = 'Timeframe for extremums')
fromyear = input(1900, defval = 1900, minval = 1900, maxval = 2100, title = "From Year")
toyear = input(2100, defval = 2100, minval = 1900, maxval = 2100, title = "To Year")
frommonth = input(01, defval = 01, minval = 01, maxval = 12, title = "From Month")
tomonth = input(12, defval = 12, minval = 01, maxval = 12, title = "To Month")
fromday = input(01, defval = 01, minval = 01, maxval = 31, title = "From day")
today = input(31, defval = 31, minval = 01, maxval = 31, title = "To day")

//Levels
highm = request.security(syminfo.tickerid, tf, high[1])
lowm = request.security(syminfo.tickerid, tf, low[1])
upcolorm = highm == highm[1] ? lime : na
dncolorm = lowm == lowm[1] ? red : na
plot(highm, color = upcolorm, linewidth = 3)
plot(lowm, color = dncolorm, linewidth = 3)

//Signals
size = strategy.position_size
up = size > 0 ? highm * 1000000 : highm != highm[1] ? highm : up[1]
dn = size < 0 ? 0 : lowm != lowm[1] ? lowm : dn[1]
exit = true

//Trading
lot = strategy.position_size != strategy.position_size[1] ? strategy.equity / close * capital / 100 : lot[1]

if highm > 0 and high[1] < highm and highm == highm[1]
    strategy.entry("Long", strategy.long, needlong == false ? 0 : lot, stop = up)

if lowm > 0 and low[1] > lowm and lowm == lowm[1]
    strategy.entry("Short", strategy.short, needshort == false ? 0 : lot, stop = dn)

if exit
    strategy.close_all()
- Parabola Oscillator Seeking Highs and Lows Strategy
- Bollinger Bands Breakout Strategy
- Breakthrough Fair Value Gap Strategy
- Adaptive Moving Average Crossover System with Momentum Breakout
- Peak-to-Peak Pattern Based Trading Strategy
- Multiple EMA Buy Strategy
- OBV EMA Crossover Trend Following Strategy
- RSI and MA Crossover Trend Tracking Strategy
- Reversal Momentum Strategy with Double Confirmation
- EMA Crossover for Long Line Quant Strategy
- Bollinger Band Mean Reversion Strategy with Intraday Intensity Index
- B-Xtrender Exponential Moving Average Crossover Strategy
- Moving Average Trend Tracking Strategy
- A Combined RSI Strategy with Moving Average and MACD
- EMA, RSI and MACD Based Multi Timeframe Trading Strategy
- Pivot Reversal Quantitative Strategy Based on Pivot Points
- Three Color Cross Trend Tracking Strategy
- Dynamic Position Building Strategy
- Dual Moving Average Chasing Strategy
- Short-term Trading Strategy Based on EMA