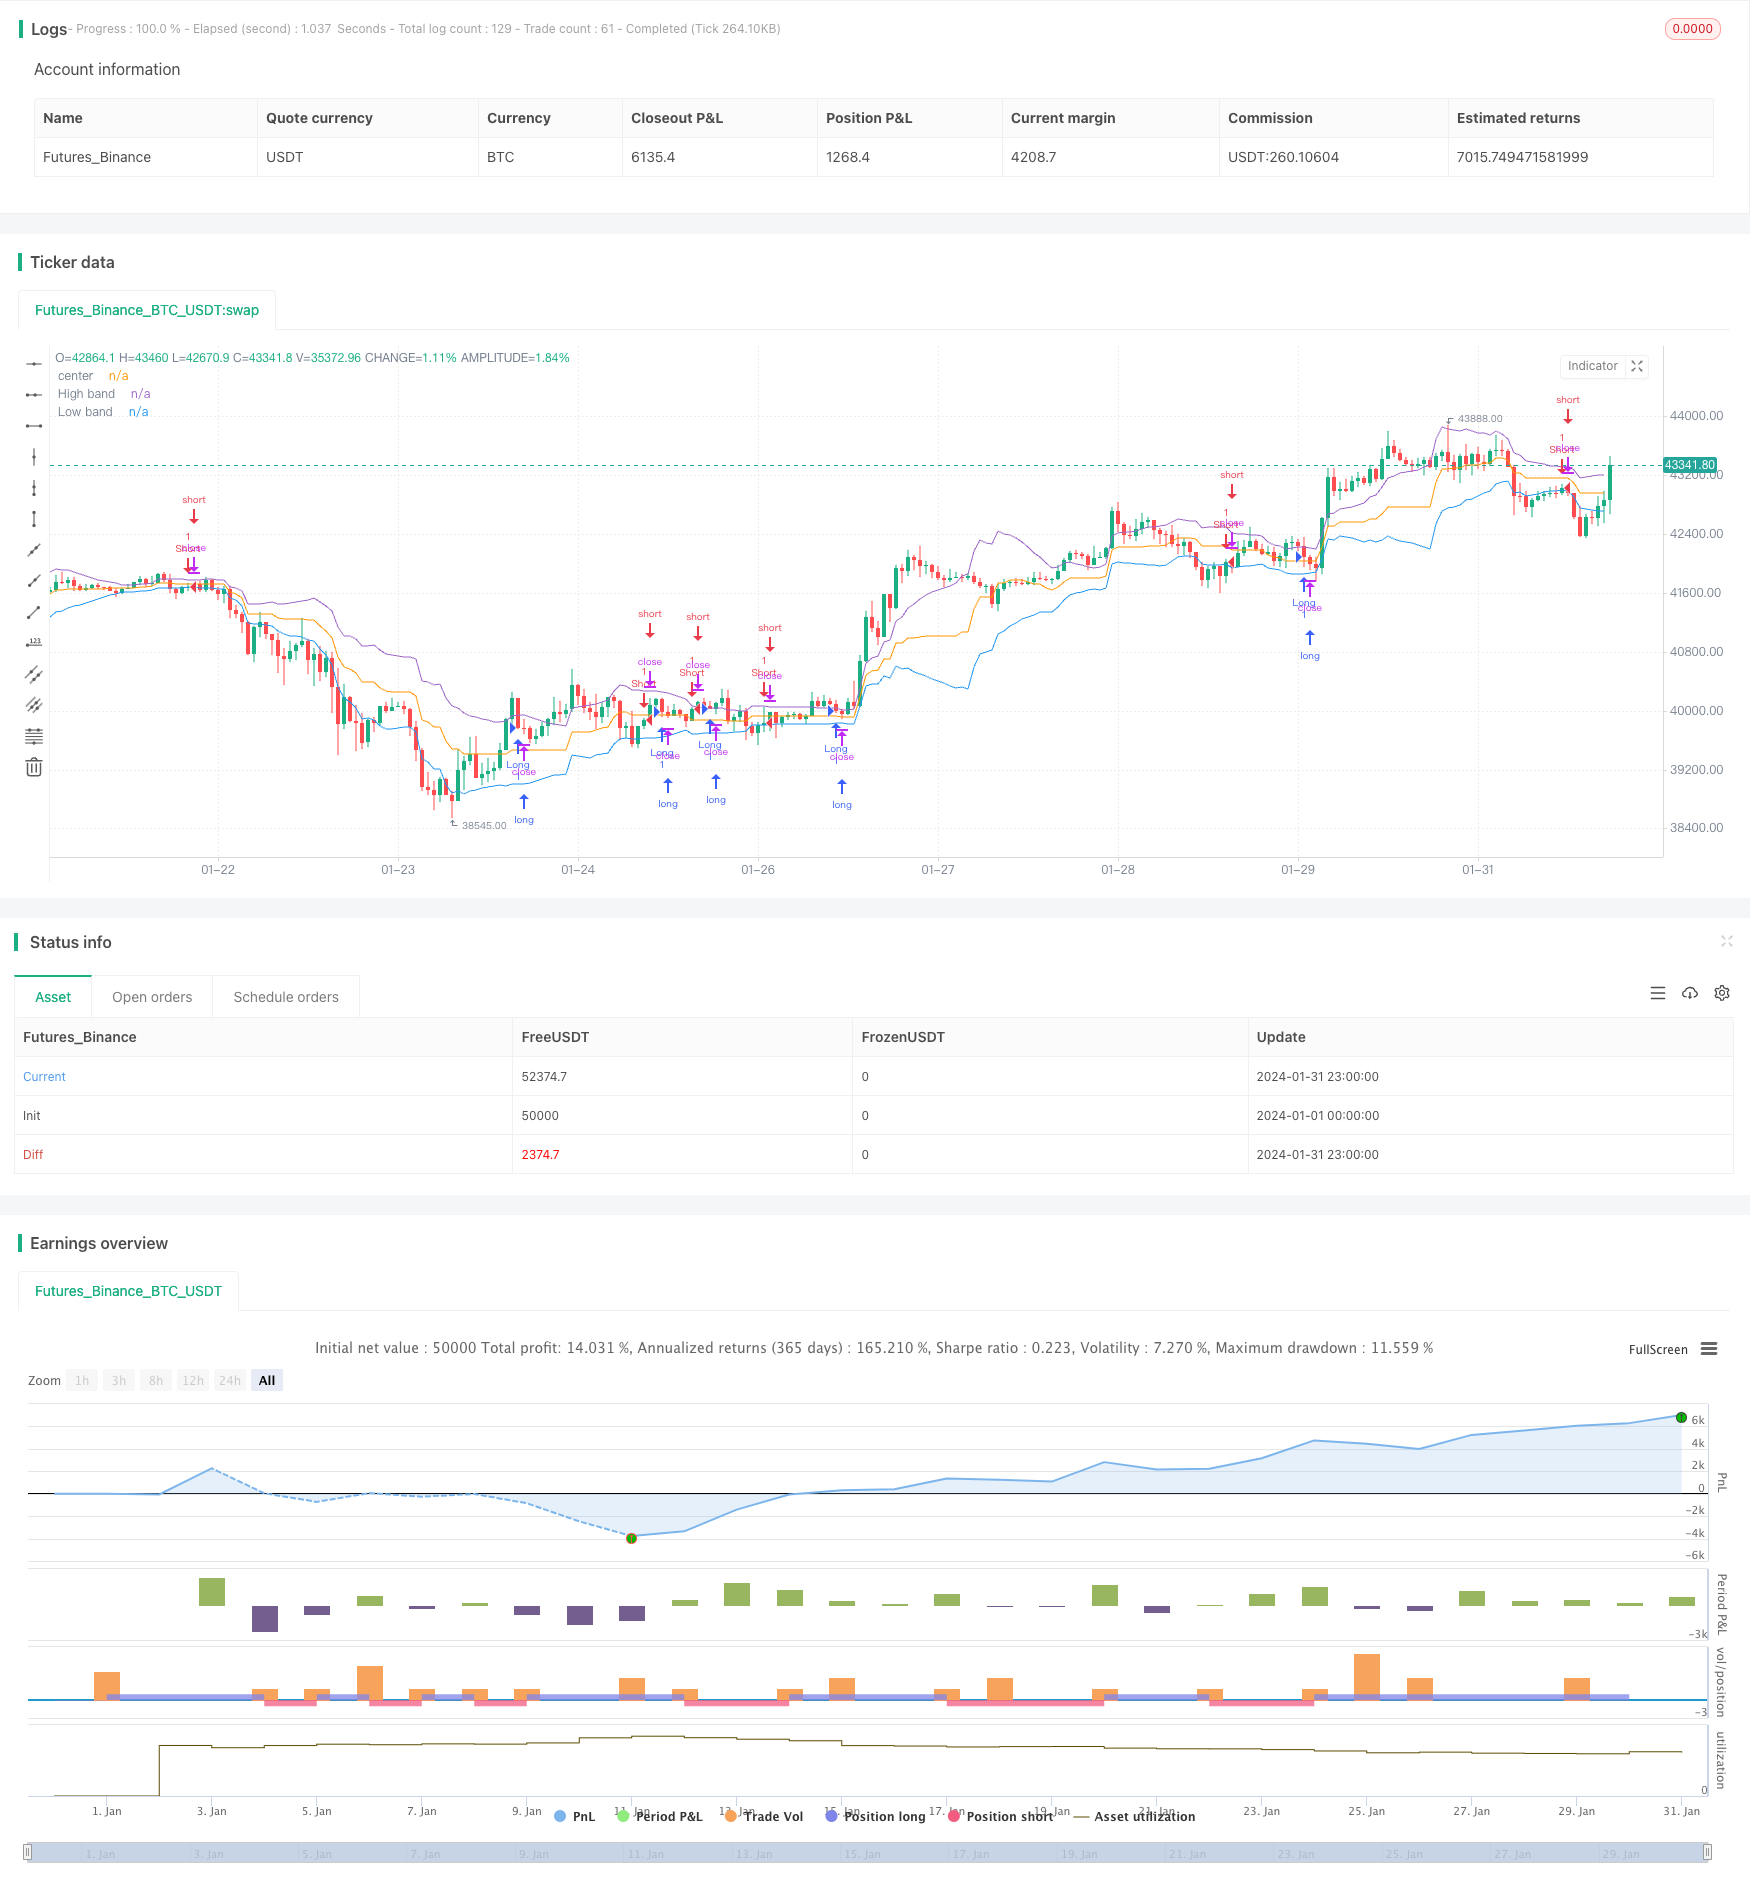
Overview
This strategy is designed based on the principle of dynamic channel and moving average trend tracking. It calculates the dynamic price channel, judges the trend direction through the upper and lower rails of the channel, and generates trading signals by combining the moving average to filter price volatility. This strategy is suitable for medium and short term trend trading.
Principle
The main principles of this strategy are:
Calculate dynamic price channel. The channel middle line is calculated from highest price and lowest price. The upper rail is middle line + price volatility MA, and the lower rail is middle line - price volatility MA.
Judge trend direction. When price breaks through the upper rail, it is defined as bullish. When price breaks through the lower rail, it is defined as bearish.
Filter noise. Use price volatility MA of a certain period to filter noise from random price fluctuations.
Generate trading signals. When bullish, a buy signal is generated when close price is lower than open price in that period. When bearish, a sell signal is generated when close price is higher than open price.
Advantages
The advantages of this strategy are:
- Dynamic channel can capture price trend in real time.
- MA filter can reduce false signals.
- Combining trend direction and K-line entity direction to generate trading signals avoids being trapped.
Risks
The risks of this strategy are:
- Improper Param selection may lead to overfitting.
- It is easy to generate wrong signals during sideways volatility.
- It cannot predict extreme price fluctuations.
Solutions:
- Strict Param selection and testing.
- Add filter conditions to identify sideways.
- Set stop loss/profit to control risks.
Optimization Directions
The strategy can be optimized in following aspects:
- Test stability of different period Params.
- Add VOLUME or volatility indicators to judge momentum.
- Combine bands, channels etc. to determine entry and exit.
Summary
This strategy integrates the ideas of dynamic channel and MA trend judgment, and performs well in capturing trend directions in medium and short term. But there are still some limitations, which need further testing and optimization to adapt more market situations.
/*backtest
start: 2024-01-01 00:00:00
end: 2024-01-31 23:59:59
period: 1h
basePeriod: 15m
exchanges: [{"eid":"Futures_Binance","currency":"BTC_USDT"}]
*/


//@version=2
strategy("Noro's Bands Strategy v1.0", shorttitle = "NoroBands str 1.0", overlay=true, default_qty_type = strategy.percent_of_equity, default_qty_value=100.0, pyramiding=0)

//Settings
needlong = input(true, defval = true, title = "Long")
needshort = input(true, defval = true, title = "Short")
len = input(20, defval = 20, minval = 2, maxval = 200, title = "Period")
color = input(true, "Color")
needbb = input(false, defval = false, title = "Show Bands")
needbg = input(false, defval = false, title = "Show Background")
src = close

//PriceChannel 1
lasthigh = highest(src, len)
lastlow = lowest(src, len)
center = (lasthigh + lastlow) / 2

//dist
dist = abs(src - center)
distsma = sma(dist, len)
hd = center + distsma
ld = center - distsma

//Trend
trend = close < ld and high < hd ? -1 : close > hd and low > ld ? 1 : trend[1]

//Lines
colo = needbb == false ? na : black
plot(hd, color = colo, linewidth = 1, transp = 0, title = "High band")
plot(center, color = colo, linewidth = 1, transp = 0, title = "center")
plot(ld, color = colo, linewidth = 1, transp = 0, title = "Low band")

//Background
col = needbg == false ? na : trend == 1 ? lime : red
bgcolor(col, transp = 90)

//up =  and trend == 1 ? 1 : 0
//dn =  and trend == -1 ? 1 : 0

up = close < hd and trend == 1 and (close < open or color == false) ? 1 : 0
dn = close > ld and trend == -1 and (close > open or color == false) ? 1 : 0

longCondition = up == 1
if (longCondition)
    strategy.entry("Long", strategy.long, needlong == false ? 0 : na)

shortCondition = dn == 1
if (shortCondition)
    strategy.entry("Short", strategy.short, needshort == false ? 0 : na)