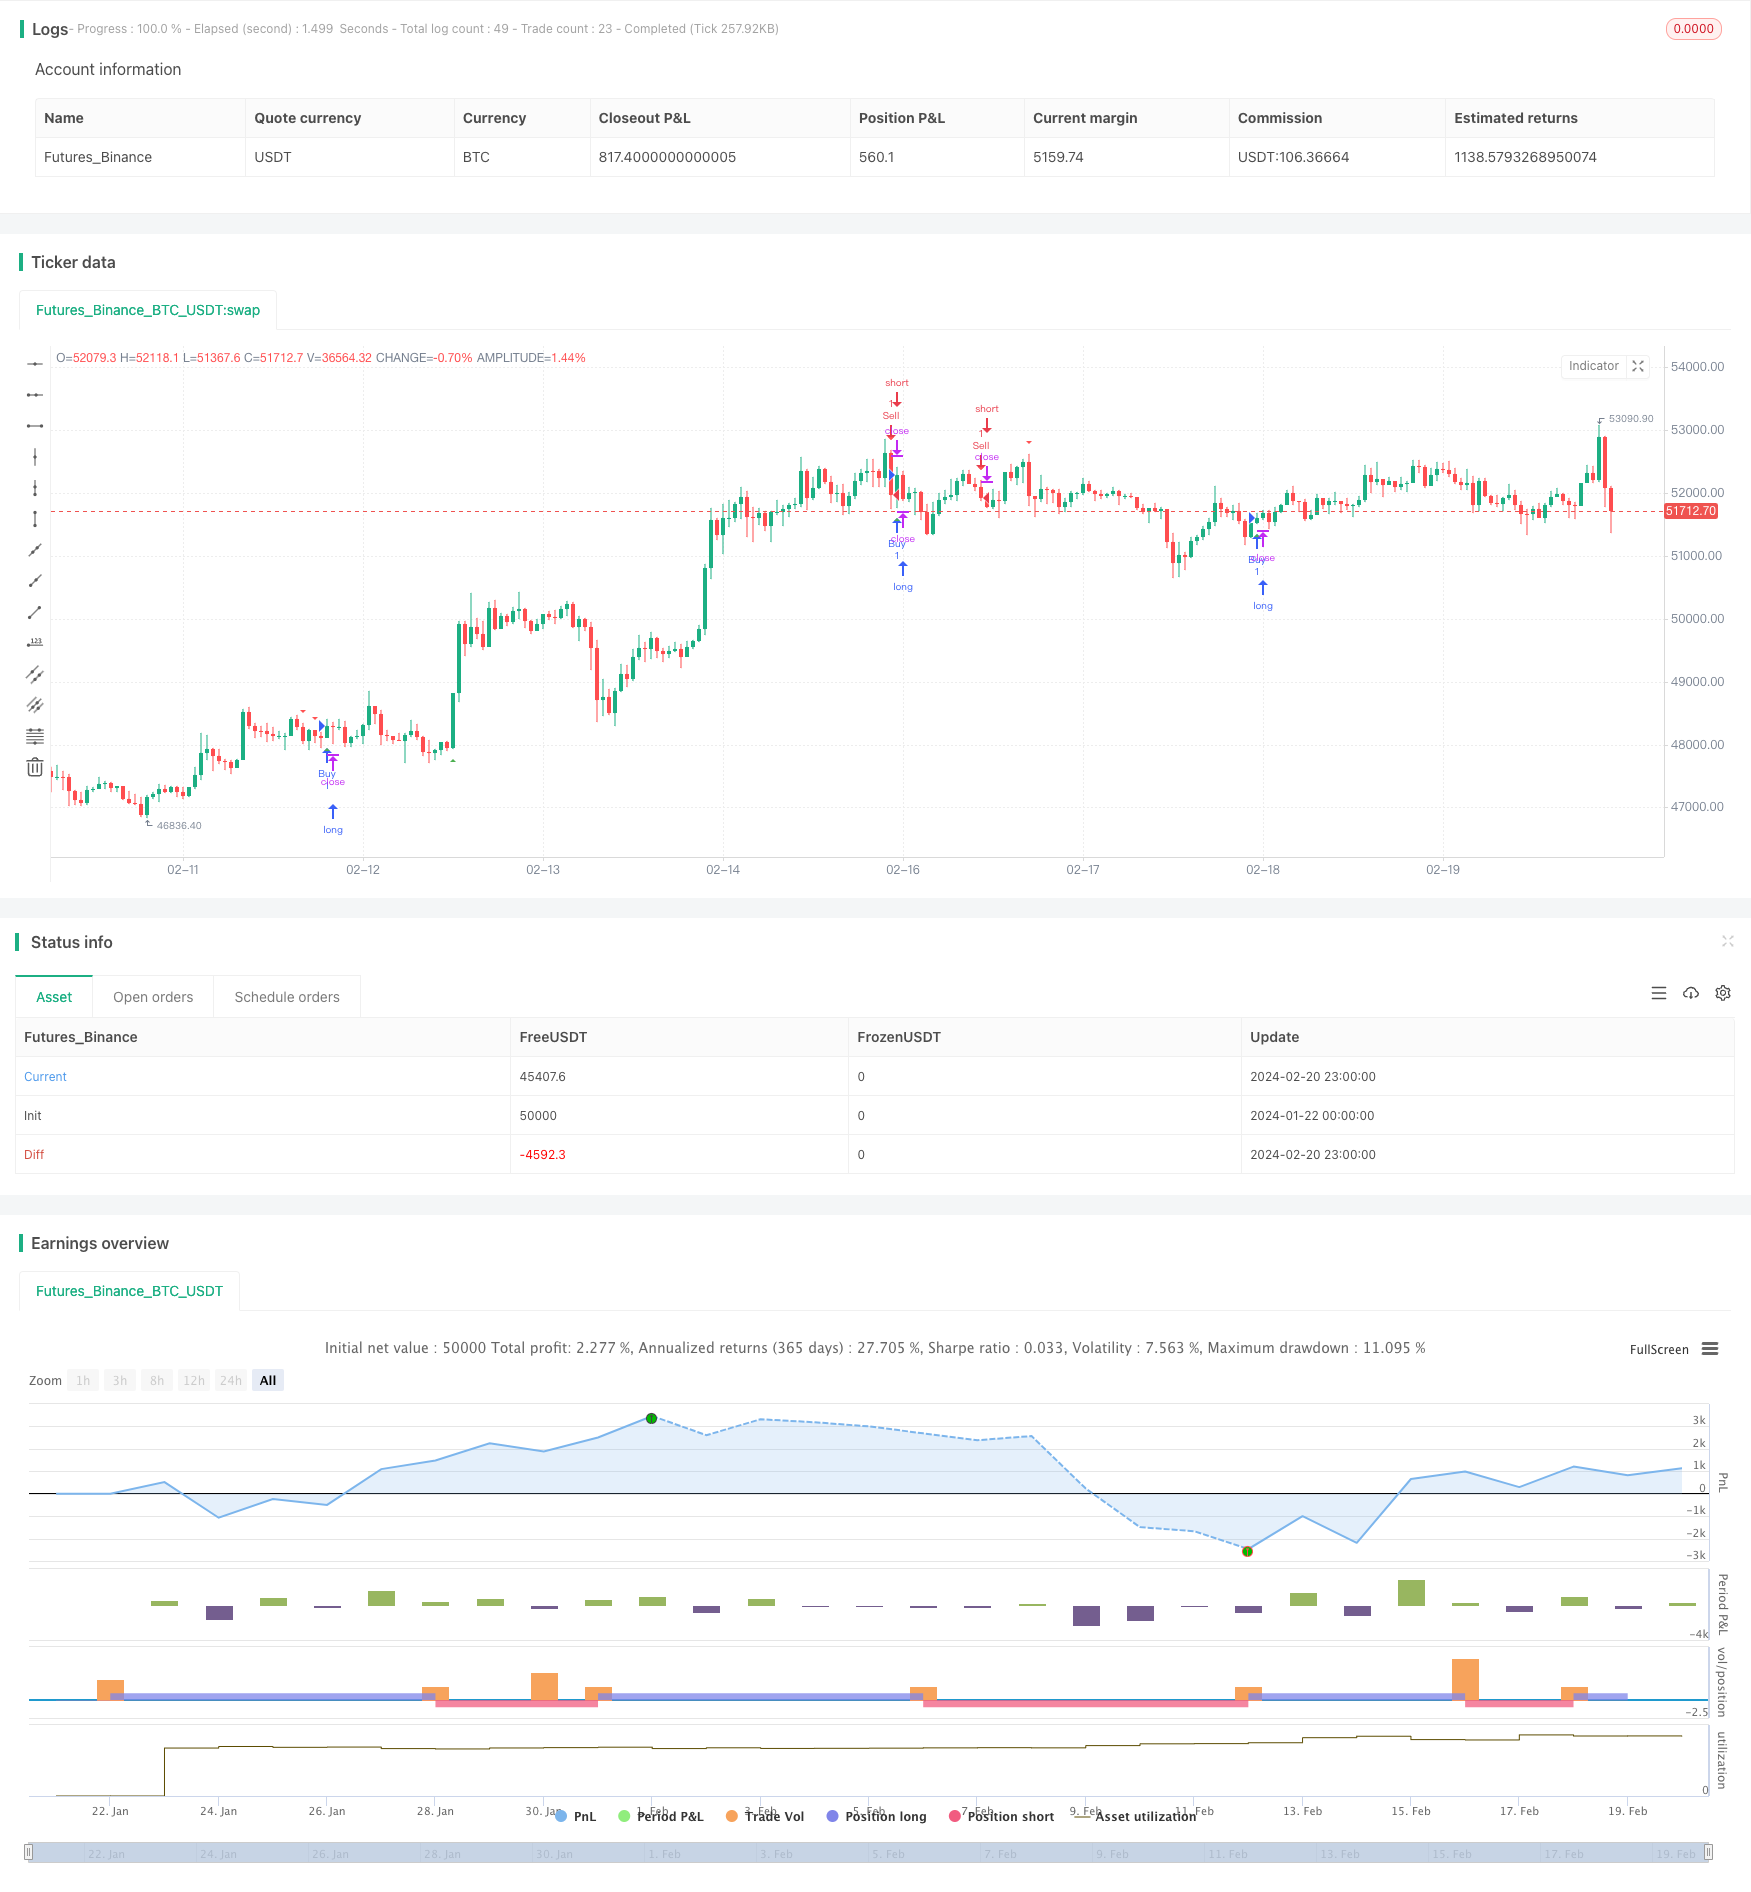
Dual Trendlines Breakout Golden Cross Death Cross Trend Following Strategy
Author: ChaoZhang, Date: 2024-02-22 16:01:12Tags:

Overview
The Dual Trendlines Breakout Golden Cross Death Cross Trend Following Strategy is a quantitative trading strategy that utilizes both support/resistance trendlines and moving averages as alternative signals for trend following. This strategy takes into account the price levels at different timeframes, combining the breakout signals through major support and resistance levels with the golden cross and death cross signals from the trend indicator, in order to open positions during early trend changes for the profit target of tracking mid-to-long term trends.
Strategy Principle
This strategy consists of four main components:
- Support line plotted with the lowest lows over the past 30 days
- Resistance line plotted with the highest highs over the past 30 weeks
- 10-period Simple Moving Average, used to confirm the trend for filtering trade signals
- Breakout Identification module to detect trading opportunities when price breaks critical support/resistance levels
Specifically, the strategy firstly uses the Security request functions to obtain the highest highs and lowest lows over the past 30 days and 30 weeks respectively, plotting dynamic support and resistance lines. It then combines the golden cross and death cross signals from the 10-period SMA to filter breakout opportunities. Long signals are generated when price breaks above the 30-day support level and the 10-period SMA, while short signals are generated when price breaks below the 30-week resistance level and the 10-period SMA.
This strategy considers both medium-term and long-term support/resistance levels, allowing it to capture larger trend opportunities. Using the moving average filter also avoids false signals effectively during ranging trends.
Advantage Analysis
The main advantages of this strategy include:
- Utilizes both medium-term and long-term support/resistance for capturing larger breakouts.
- The MA filter controls losses by avoiding false signals during ranging markets.
- Dynamic updates of support/resistance levels allow timely catches of new trend directions.
- The risk management mechanisms of stop loss and take profit help secure profits.
Risk Analysis
There are also some risks to note for this strategy:
- Breakout strategies require precise timing, with overshoot or lagging issues.
- Invalid breakouts can occur when support/resistance levels fail, causing huge losses.
- The lagging nature of moving averages may cause late signals for trend reversals.
- High drawdown risks make it unsuitable for small accounts.
Solutions:
- Fine tune breakout identification logic and add more filters.
- Use larger MA periods to ensure signals only occur after trends stabilize.
- Set proper stop loss levels to limit downside on single trades.
Optimization Directions
There is room for further improvements:
- Incorporate volatility measures like ATR for smarter stop loss and take profitsizing.
- Add machine learning models to detect support/resistance failure.
- Utilize adaptive moving averages for quicker catches of reversals.
- Fine tune parameters for different products.
Conclusion
The Dual Trendlines Breakout Golden Cross Death Cross Trend Following Strategy effectively combines medium-to-long term support/resistance and moving average indicators for filtering profitable signals during major trends, making it a relatively mature quantitative trading strategy. There is still large room for optimization via stop loss mechanisms, adaptive parameters etc. Incorporating machine learning can also enhance its robustness.
/*backtest
start: 2024-01-22 00:00:00
end: 2024-02-21 00:00:00
period: 1h
basePeriod: 15m
exchanges: [{"eid":"Futures_Binance","currency":"BTC_USDT"}]
*/

// This Pine Script™ code is subject to the terms of the Mozilla Public License 2.0 at https://mozilla.org/MPL/2.0/
// © neosaid

//@version=5
strategy("Support and resistant Strategy", overlay=true)

// Function to check for breakout
f_breakoutCondition(closingPrice, highestHigh, lowestLow) =>
    closingPrice > highestHigh or closingPrice < lowestLow

// Step 1: 30 Days Trend Line (Lower Lows)
low30Days = request.security(syminfo.tickerid, "D", low)

// Step 2: 30 Weeks Upper Trend Line (Higher Highs)
high30Weeks = request.security(syminfo.tickerid, "W", high)

// Step 3: Trend Line for Lowest Low within the Last Month
var float lowestLowLastMonth = na
for i = 0 to 29
    lowestLowLastMonth := na(lowestLowLastMonth) ? low[i] : math.min(lowestLowLastMonth, low[i])

lowestLowLastMonthValue = lowestLowLastMonth[1]

// Breakout Strategy
highestHighLast3Candles = request.security(syminfo.tickerid, "D", ta.highest(close, 3))
lowestLowLast3Candles = request.security(syminfo.tickerid, "D", ta.lowest(close, 3))

// Additional conditions to filter signals
buyCondition = f_breakoutCondition(close, highestHighLast3Candles, lowestLowLast3Candles) and close > low30Days

sellCondition = f_breakoutCondition(close, highestHighLast3Candles, lowestLowLast3Candles) and close < high30Weeks

// Additional filters to reduce the number of orders
buyFilter = ta.crossover(close, ta.sma(close, 10)) // Buy only when price crosses above a 10-period SMA
sellFilter = ta.crossunder(close, ta.sma(close, 10)) // Sell only when price crosses below a 10-period SMA

buyCondition := buyCondition and buyFilter
sellCondition := sellCondition and sellFilter

// Plot Buy and Sell signals on the chart
plotshape(series=buyCondition, title="Buy Signal", color=color.green, style=shape.triangleup, location=location.belowbar)
plotshape(series=sellCondition, title="Sell Signal", color=color.red, style=shape.triangledown, location=location.abovebar)

// Strategy entries
strategy.entry("Buy", strategy.long, when = buyCondition)
strategy.entry("Sell", strategy.short, when = sellCondition)
- The Moving Average Crossover Trading Strategy
- Moving Average Crossover Gold Trading Strategy
- EMA and MACD Trend Following Strategy
- Moving Average Crossover MACD Trading Strategy
- Super Trend Daily Reversal Strategy
- Dual EMA Crossover Strategy
- Trend Tracking Strategy Based on RSI and ZigZag Indicators
- Moving Average Crossover Breakout Strategy
- Momentum Breakout Backtesting Support Resistance Strategy
- MyQuant Trend Identifier Strategy
- Nifty 50 Quantitative Trading Strategy Based on Dynamic Position Adjustment with Support and Resistance Levels
- Dynamic Channel Moving Average Trend Tracking Strategy
- Harmonic Dual System Strategy
- Breakthrough Callback Long Strategy
- MA Crossover Trading Strategy Based on Short-term and Long-term Moving Average Crossovers
- Dual Moving Average Crossover MACD Quantitative Strategy
- Dual Moving Average Pressure Rebound Strategy
- Four WMA Trend Tracking Strategy
- Trend Following Strategy Based on Nadaraya-Watson Regression and ATR Channel
- Trend Tracking Strategy Based on Moving Average Crossover