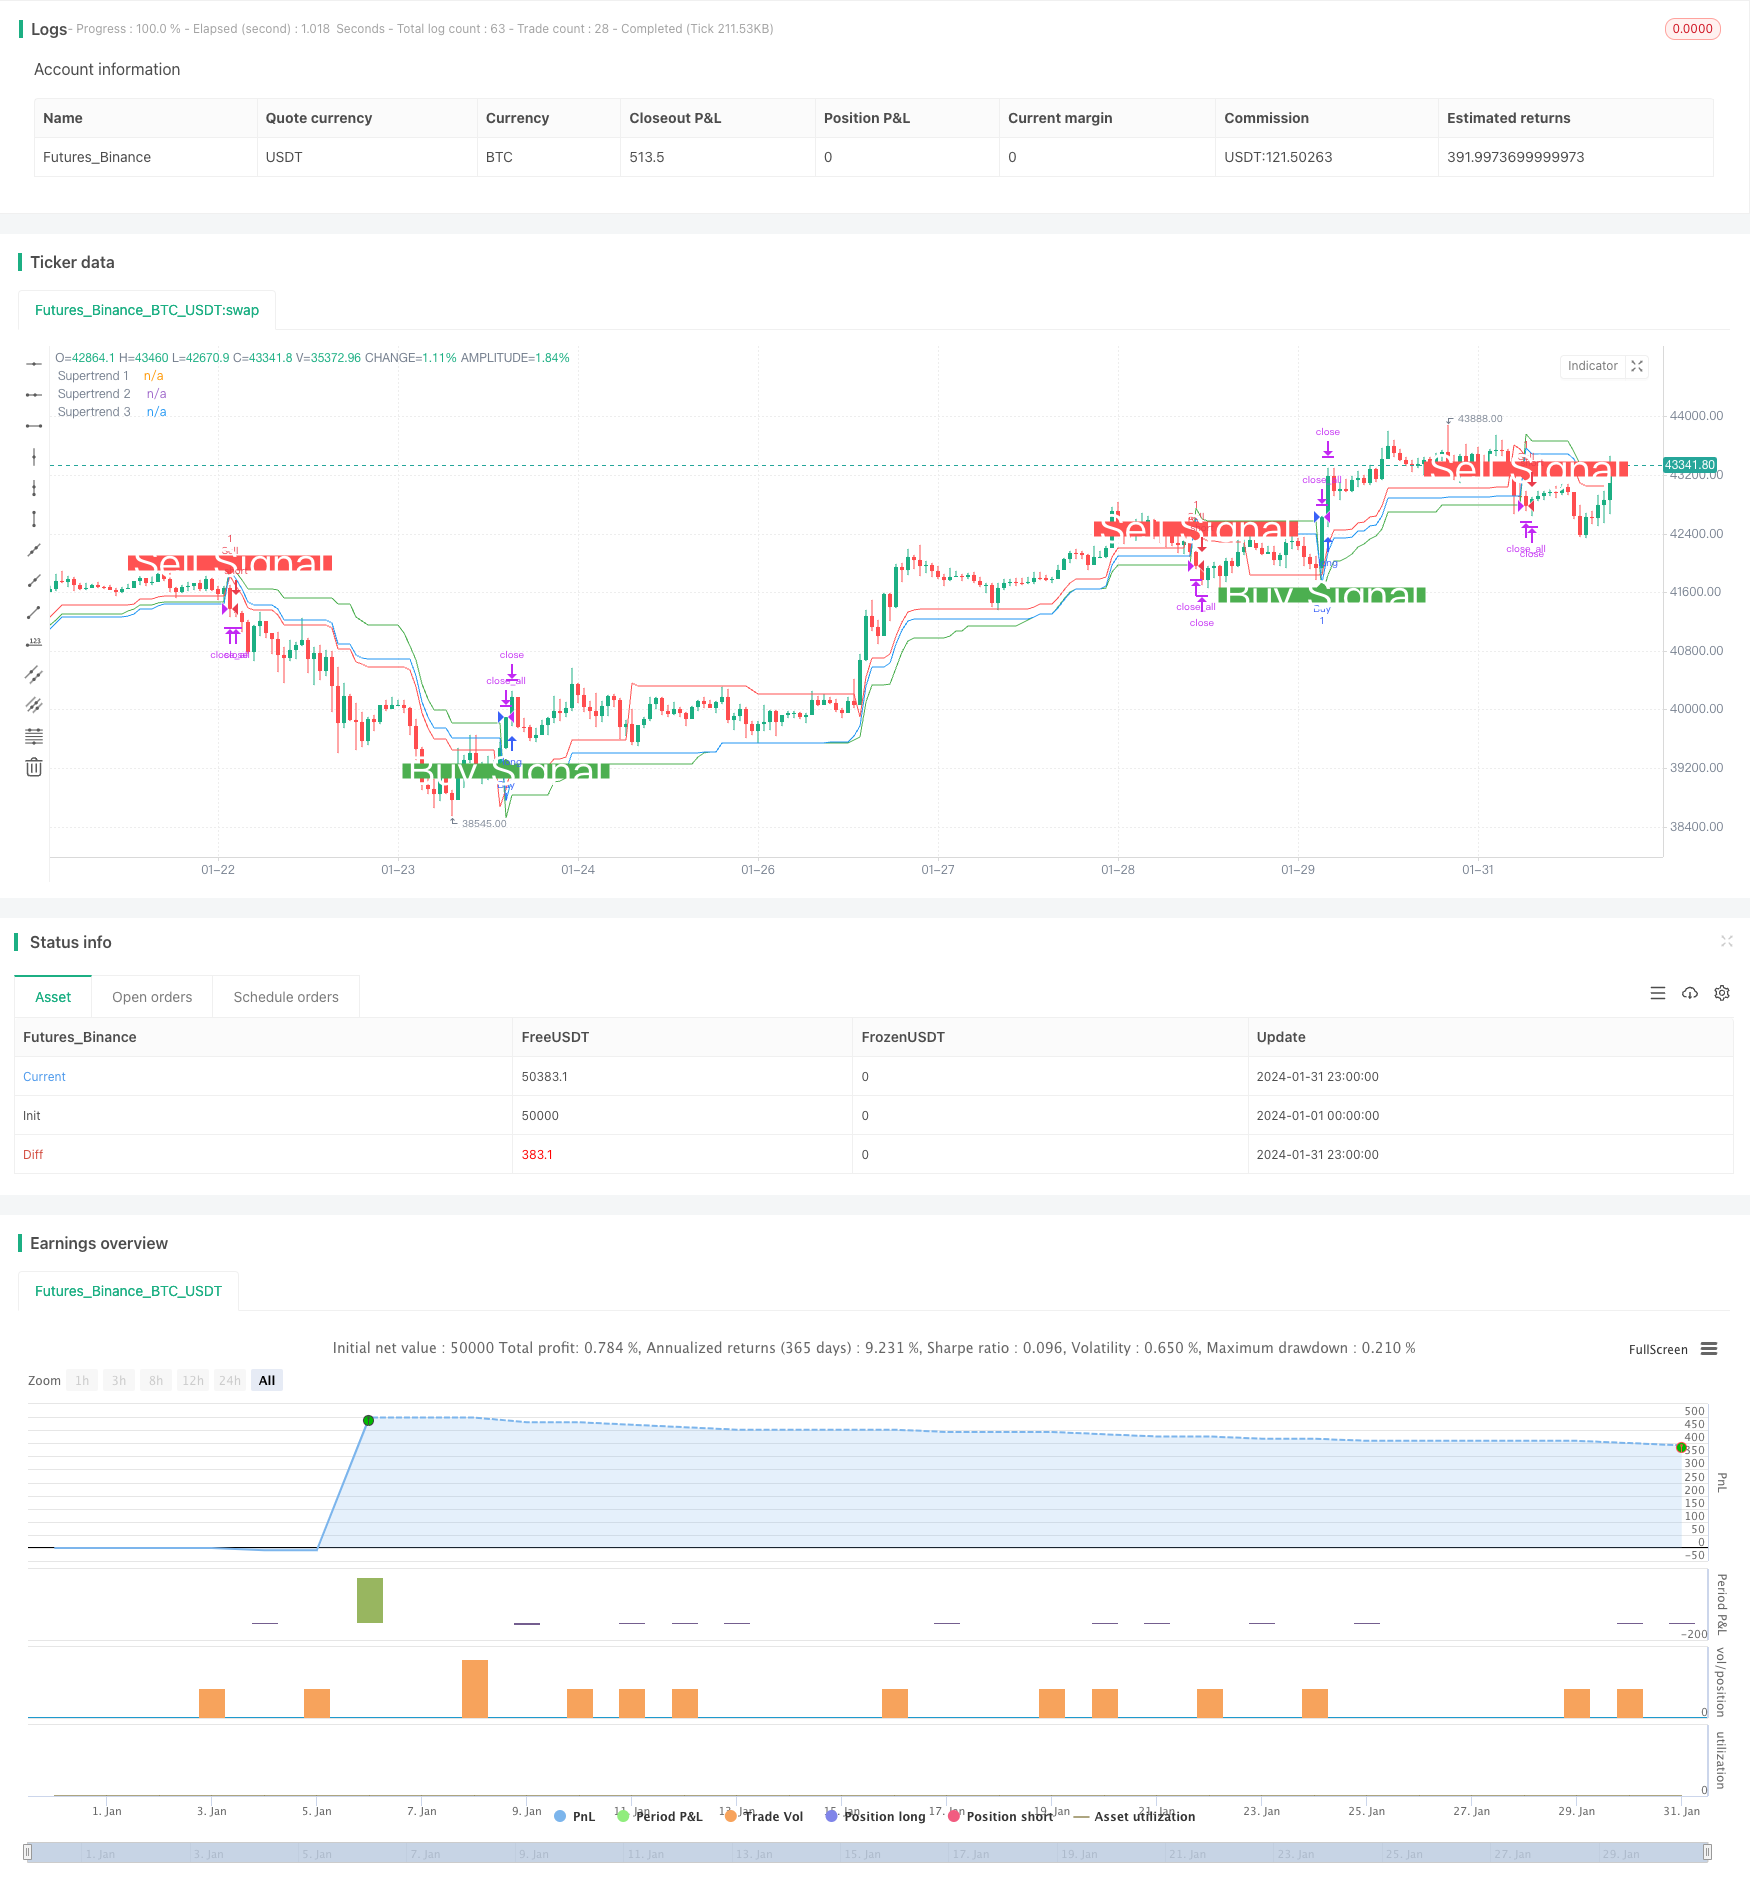
Threefold Overlapping SuperTrend Strategy
Author: ChaoZhang, Date: 2024-02-26 10:04:18Tags:

Overview
This is a strategy that makes trading decisions based on three overlapping SuperTrend indicators. It can capture larger directional opportunities in trending markets.
Strategy Logic
The strategy uses the ta.supertrend() function to calculate three SuperTrend indicators with different parameter settings, namely SuperTrend1 with 10 days and a multiplier of 3, SuperTrend2 with 14 days and a multiplier of 2, and SuperTrend3 with 20 days and a multiplier of 2.5. A buy signal is generated when the price crosses above all three SuperTrend lines. A sell signal is generated when the price crosses below all three SuperTrend lines.
The SuperTrend indicator incorporates the ATR indicator to effectively track price trend changes. The strategy of three overlapping SuperTrends makes the signals more reliable, thereby capturing greater profits in trending markets.
Advantages
- Triple filter mechanism avoids false signals and improves signal quality
- The SuperTrend itself has good noise reduction capability
- Multiple combinations of hyperparameters can be configured to suit more market environments
- Good historical performance with high return to risk ratio
Risks
- Multiple filtering signals may miss some opportunities
- Does not perform well in ranging markets
- Requires optimization of combinations of three sets of hyperparameters
- Concentrated trading time is susceptible to sudden events
The following can be considered to reduce risks: 1. Adjust the filtering conditions, keep one or two SuperTrends 2. Add stop loss strategy 3. Optimize hyperparameters to improve win rate
Optimization Directions
- Test more parameter combinations to find optimal hyperparameters
- Add machine learning algorithms for real-time parameter optimization
- Add stop loss strategies to control single loss
- Incorporate other indicators to identify trends and ranges
- Extend trading time to avoid risks at a single time point
Conclusion
This strategy makes decisions based on three overlapping SuperTrends, which can effectively identify trend direction. It has advantages like high signal quality and configurable parameters. At the same time, there are also certain risks. Parameters and exit timing need to be adjusted to adapt to different market environments. Overall, the strategy performs exceptionally well and is worth further research and application.
/*backtest
start: 2024-01-01 00:00:00
end: 2024-01-31 23:59:59
period: 1h
basePeriod: 15m
exchanges: [{"eid":"Futures_Binance","currency":"BTC_USDT"}]
*/

//@version=5
strategy('Combined Supertrend Strategy - Ajit Prasad', overlay=true)

// Function to calculate Supertrend
supertrendFunc(atrLength, factor) =>
    [supertrend, direction] = ta.supertrend(factor, atrLength)
    [supertrend, direction]

// Input parameters for the first Supertrend
atrPeriod1 = input(10, 'ATR Length 1')
factor1 = input(3, 'Factor 1')

// Calculate the first Supertrend
[supertrend1, direction1] = supertrendFunc(atrPeriod1, factor1)

// Input parameters for the second Supertrend
atrPeriod2 = input(14, 'ATR Length 2') // Change values as needed
factor2 = input(2, 'Factor 2') // Change values as needed

// Calculate the second Supertrend
[supertrend2, direction2] = supertrendFunc(atrPeriod2, factor2)

// Input parameters for the third Supertrend
atrPeriod3 = input(20, 'ATR Length 3') // Change values as needed
factor3 = input(2.5, 'Factor 3') // Change values as needed

// Calculate the third Supertrend
[supertrend3, direction3] = supertrendFunc(atrPeriod3, factor3)

// Define market opening and closing times
marketOpenHour = 9
marketOpenMinute = 15
marketCloseHour = 15
marketCloseMinute = 30
exitTimeHour = 15
exitTimeMinute = 10

// Fetch historical close values using security function
histClose = request.security(syminfo.tickerid, "D", close)

// Buy condition
buyCondition = close > supertrend1 and close > supertrend2 and close > supertrend3 and close[1] <= supertrend1[1]

// Sell condition
sellCondition = close < supertrend1 and close < supertrend2 and close < supertrend3 and close[1] >= supertrend1[1]

// Exit conditions
buyExitCondition = close < supertrend1[1] or close < supertrend2[1] or close < supertrend3[1]
sellExitCondition = close > supertrend1[1] or close > supertrend2[1] or close > supertrend3[1]

// Execute orders with market timing
if true
    // Buy condition without 'and not'
    strategy.entry('Buy', strategy.long, when = buyCondition)

    // Sell condition without 'and not'
    strategy.entry('Sell', strategy.short, when = sellCondition)

    // Close conditions
    strategy.close('Buy', when = buyExitCondition )
    strategy.close('Sell', when = sellExitCondition)

// Close all trades at 3:10 pm IST
if true
    strategy.close_all()

// Plot Supertrends
plot(supertrend1, 'Supertrend 1', color=color.new(color.green, 0), style=plot.style_linebr)
plot(supertrend2, 'Supertrend 2', color=color.new(color.red, 0), style=plot.style_linebr)
plot(supertrend3, 'Supertrend 3', color=color.new(color.blue, 0), style=plot.style_linebr)

// Plot labels
plotshape(buyCondition, style=shape.labelup, location=location.belowbar, color=color.new(color.green, 0), size=size.large, text='Buy Signal', textcolor=color.new(color.white, 0))
plotshape(sellCondition, style=shape.labeldown, location=location.abovebar, color=color.new(color.red, 0), size=size.large, text='Sell Signal', textcolor=color.new(color.white, 0))
- The Order Block Momentum Breakout Strategy
- Dual EMA Intelligent Tracking Strategy
- Moving Average Trading Strategy
- Dual Moving Average HullMA Crossover Trend Strategy
- Dynamic Dual Moving Average Trailing Stop Strategy
- Moving Average Indicator Strategy
- Pivot Point SuperTrend Strategy
- Elliott Wave Strategy with 200 Day Moving Average
- Supertrend and CCI Scalping Strategy
- Supertrend and CCI Scalping Strategy
- Trend Following Strategy Based on Moving Average Crossover
- Spaced Out Trading Strategy
- MoonFlag MACD Momentum StochRSI Trading Strategy
- Institutional Trader Strategy Based on Price Action
- Rainbow Oscillator Trading Strategy
- Trend Following Strategy Based on Moving Average Combination
- Average Line Breakthrough Strategy
- Polynomial Trailing Stop Strategy
- SPY RSI Stochastics Crossover Reversal Trend Strategy
- All about the ATR and EMA based trend following strategy