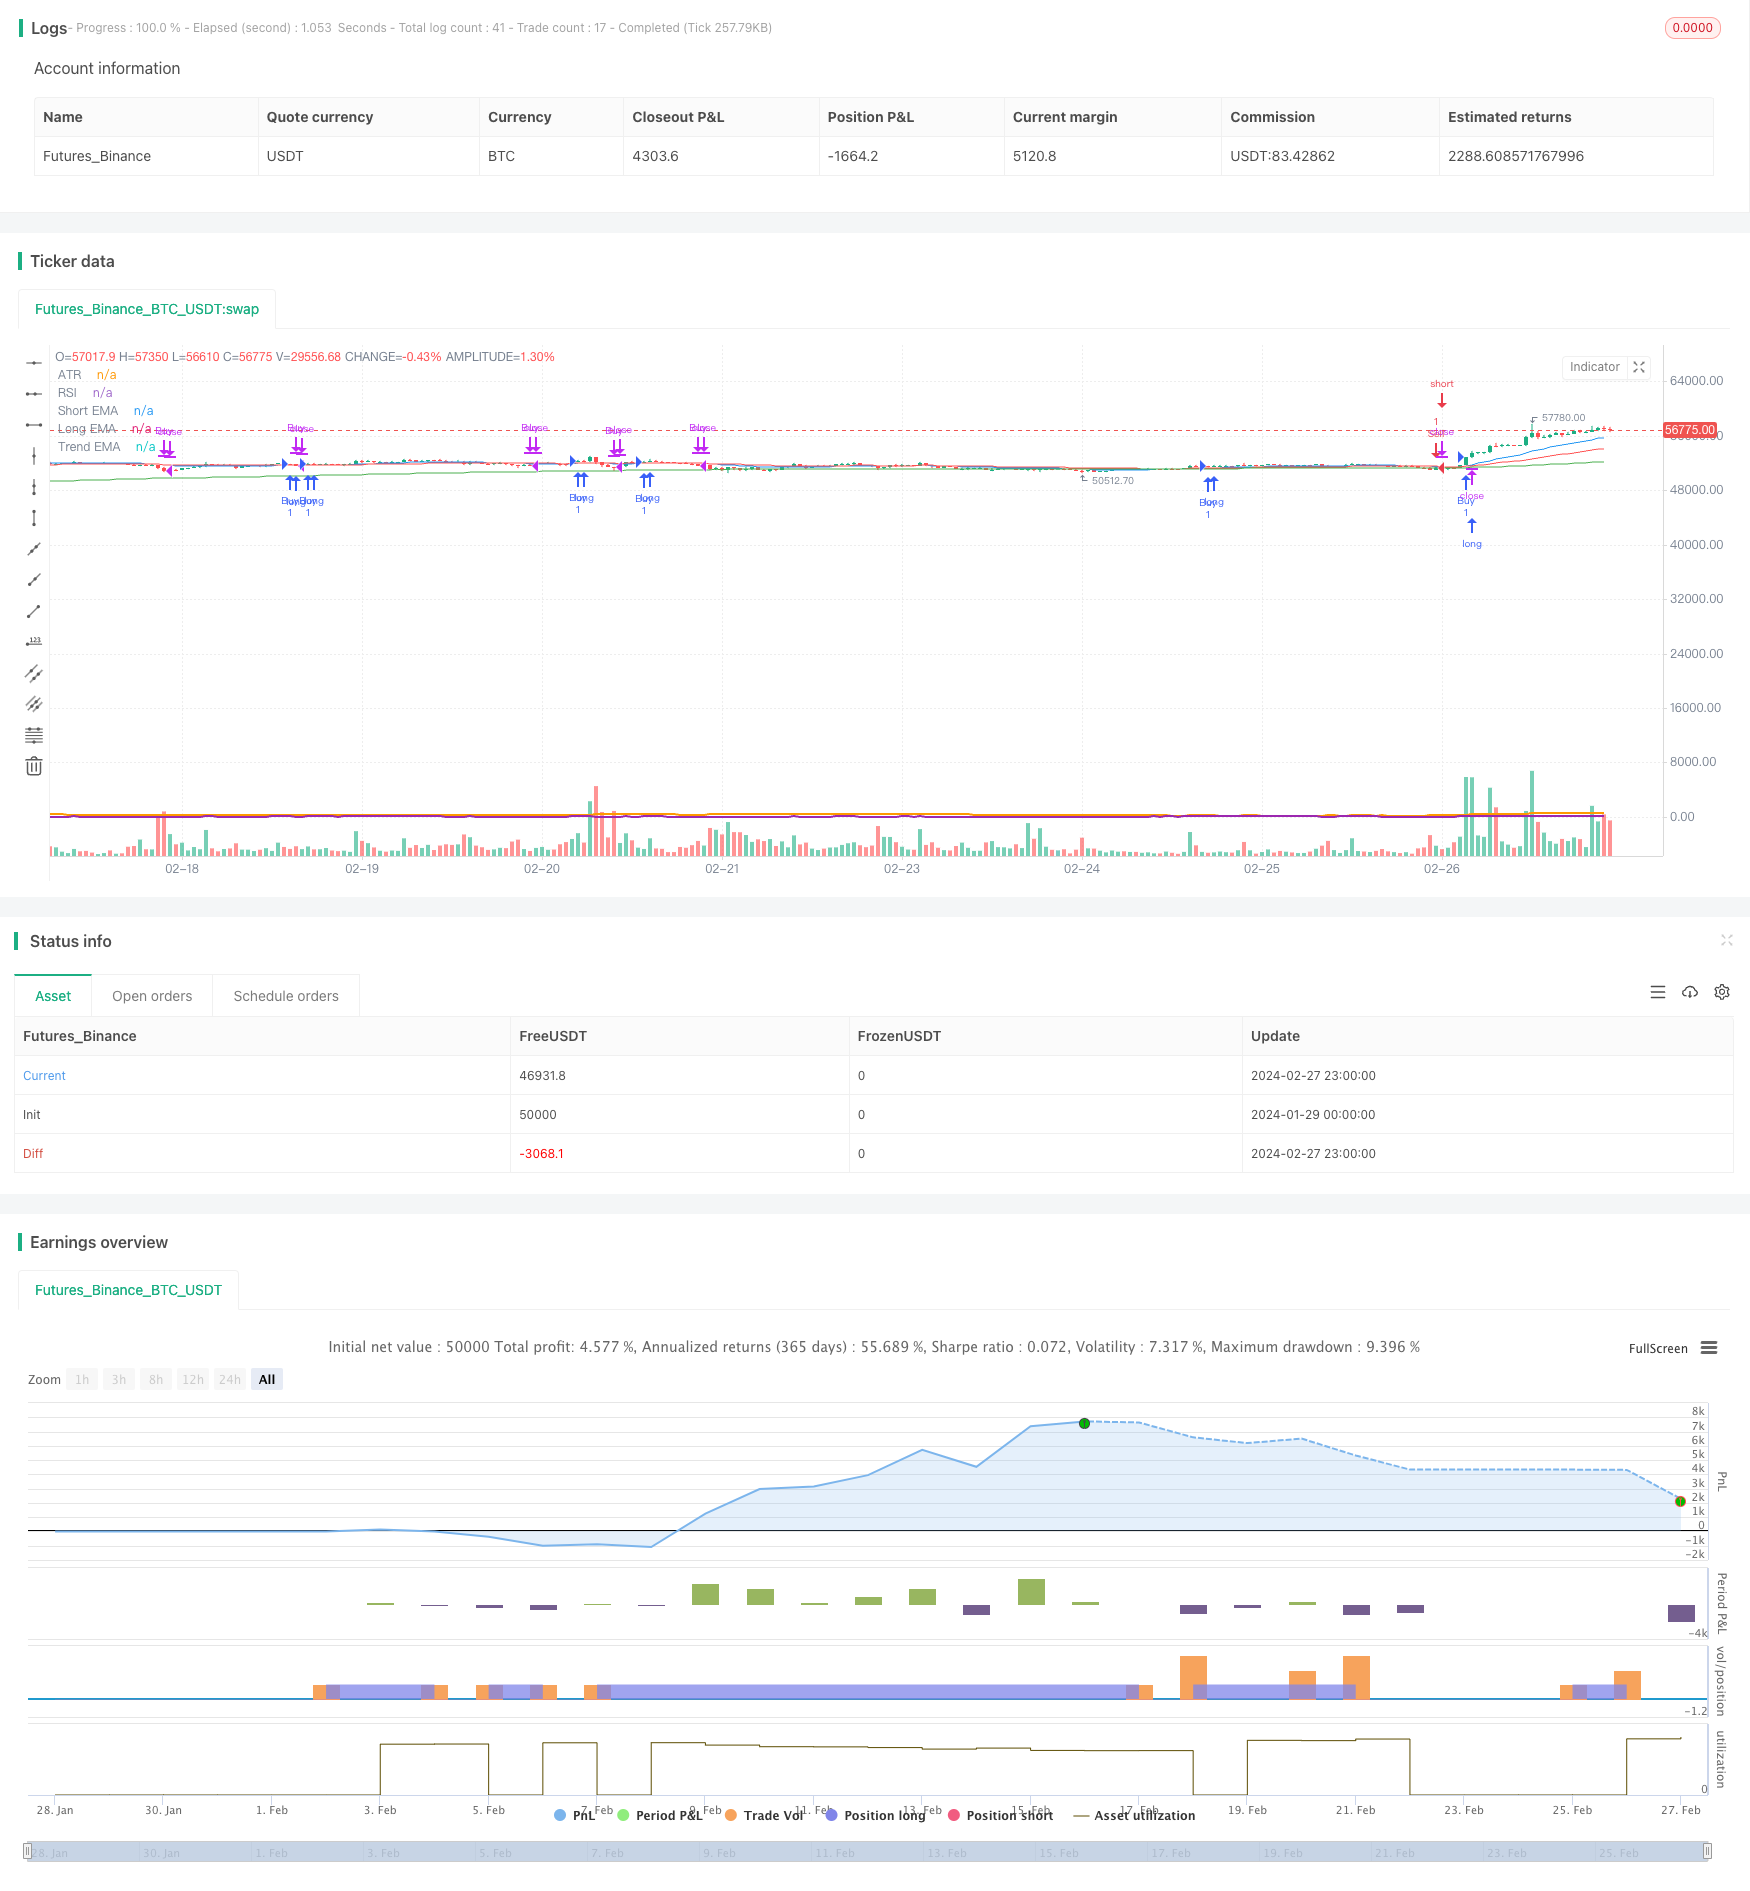
An Advanced EMA Trend Following Strategy with Relaxed RSI and ATR Filters
Author: ChaoZhang, Date: 2024-02-29 14:44:10Tags:

Overview
This is an EMA trend following strategy incorporating RSI and ATR filters, aiming to capture long term trends. It utilizes fast and slow EMA crossovers along with a long term EMA trend filter, relaxed RSI oversold/overbought levels, and ATR-based consolidation detection to reduce whipsaws.
Strategy Logic
- Long when fast EMA (20) crosses above slow EMA (50)
- Short when fast EMA crosses below slow EMA
- Only trade in the direction of long term trend judged by 200 EMA
- Require RSI to be relatively oversold for longs and overbought for shorts
- Use ATR to detect consolidation zones to avoid false breakouts
Advantages
- EMA crossover system effective for trend following
- Additional long term filter avoids trading counter trend
- Relaxed RSI thresholds reduce missed profitable trends
- ATR filter helps navigate choppy consolidation periods
Risks
- Can underperform in strongly trending bull markets
- Whipsaws possible with EMA crossovers during consolidation
- RSI and ATR parameters need individual optimization per instrument
Enhancements
- Optimize EMA lengths for different instruments
- Fine tune RSI and ATR parameters to improve consolidation detection
- Consider adding profit taking via trailing stops
Conclusion
Overall an effective system for long term trend following across various instruments. Optimization of parameters combined with prudent risk management can lead to positive results, especially in persistent bull market environments. The incorporation of auxiliary indicators like RSI and ATR make this an advanced EMA trend system.
/*backtest
start: 2024-01-29 00:00:00
end: 2024-02-28 00:00:00
period: 1h
basePeriod: 15m
exchanges: [{"eid":"Futures_Binance","currency":"BTC_USDT"}]
*/

//@version=5
strategy("EMA Strategy with Trend Filter", overlay=true)

// Параметры EMA
shortEmaLength = input(20, title="Short EMA")
longEmaLength = input(50, title="Long EMA")
trendEmaLength = input(200, title="Trend EMA")
shortEma = ta.ema(close, shortEmaLength)
longEma = ta.ema(close, longEmaLength)
trendEma = ta.ema(close, trendEmaLength)

// Параметры RSI
rsiLength = input(14, title="RSI Length")
rsi = ta.rsi(close, rsiLength)

// Параметры ATR
atrLength = input(14, title="ATR Length")
atr = ta.atr(atrLength)

// Логика для сигналов покупки и продажи с фильтром по тренду
buySignal = ta.crossover(shortEma, longEma) and close > trendEma
sellSignal = ta.crossunder(shortEma, longEma) and close < trendEma

// Вход в сделки
if (buySignal)
    strategy.entry("Buy", strategy.long)

if (sellSignal)
    strategy.entry("Sell", strategy.short)

// Выход из сделок на основе EMA пересечений
exitBuySignal = ta.crossunder(shortEma, longEma)
exitSellSignal = ta.crossover(shortEma, longEma)

if (exitBuySignal)
    strategy.close("Buy")

if (exitSellSignal)
    strategy.close("Sell")

// Визуализация EMA
plot(shortEma, color=color.blue, title="Short EMA")
plot(longEma, color=color.red, title="Long EMA")
plot(trendEma, color=color.green, title="Trend EMA")

// Отдельная панель для RSI и его визуализация
plot(rsi, title="RSI", color=color.purple, linewidth=2)

// Отдельная панель для ATR и его визуализация
plot(atr, title="ATR", color=color.orange, linewidth=2)
More
- Elevated Touch Short Triangle Strategy
- Moving Average Crossover Trend Following Strategy
- Double Confirmation Breakthrough Strategy
- Walnut Trend Following Strategy Based on Distance from 200 EMA
- VWAP Trend Following Strategy
- Turtle Trend Strategy
- Market Reversal Momentum Strategy
- Triple BB Bands Breakout with RSI Strategy
- Dual Moving Average Channel Trading Strategy
- Adaptive Channel Breakout Strategy
- Triple Confirmation Trend Tracking Strategy
- Multiple Moving Average Trading Strategy
- Turtle Trading Decision System
- Wave Buying and Selling Reversal 5 Minutes Timeframe Strategy
- RSI-based Auto Trading Strategy
- The Compound Breakout Strategy
- The Momentum Breakout Strategy
- Trend Following Moving Average Strategy
- Momentum Crossover Strategy with Dynamic Trailing Stop Loss
- EMA and RSI Quantitative Trading Strategy