Adaptive Channel Breakout Strategy
Author: ChaoZhang, Date: 2024-02-29 14:49:05Tags:

Overview
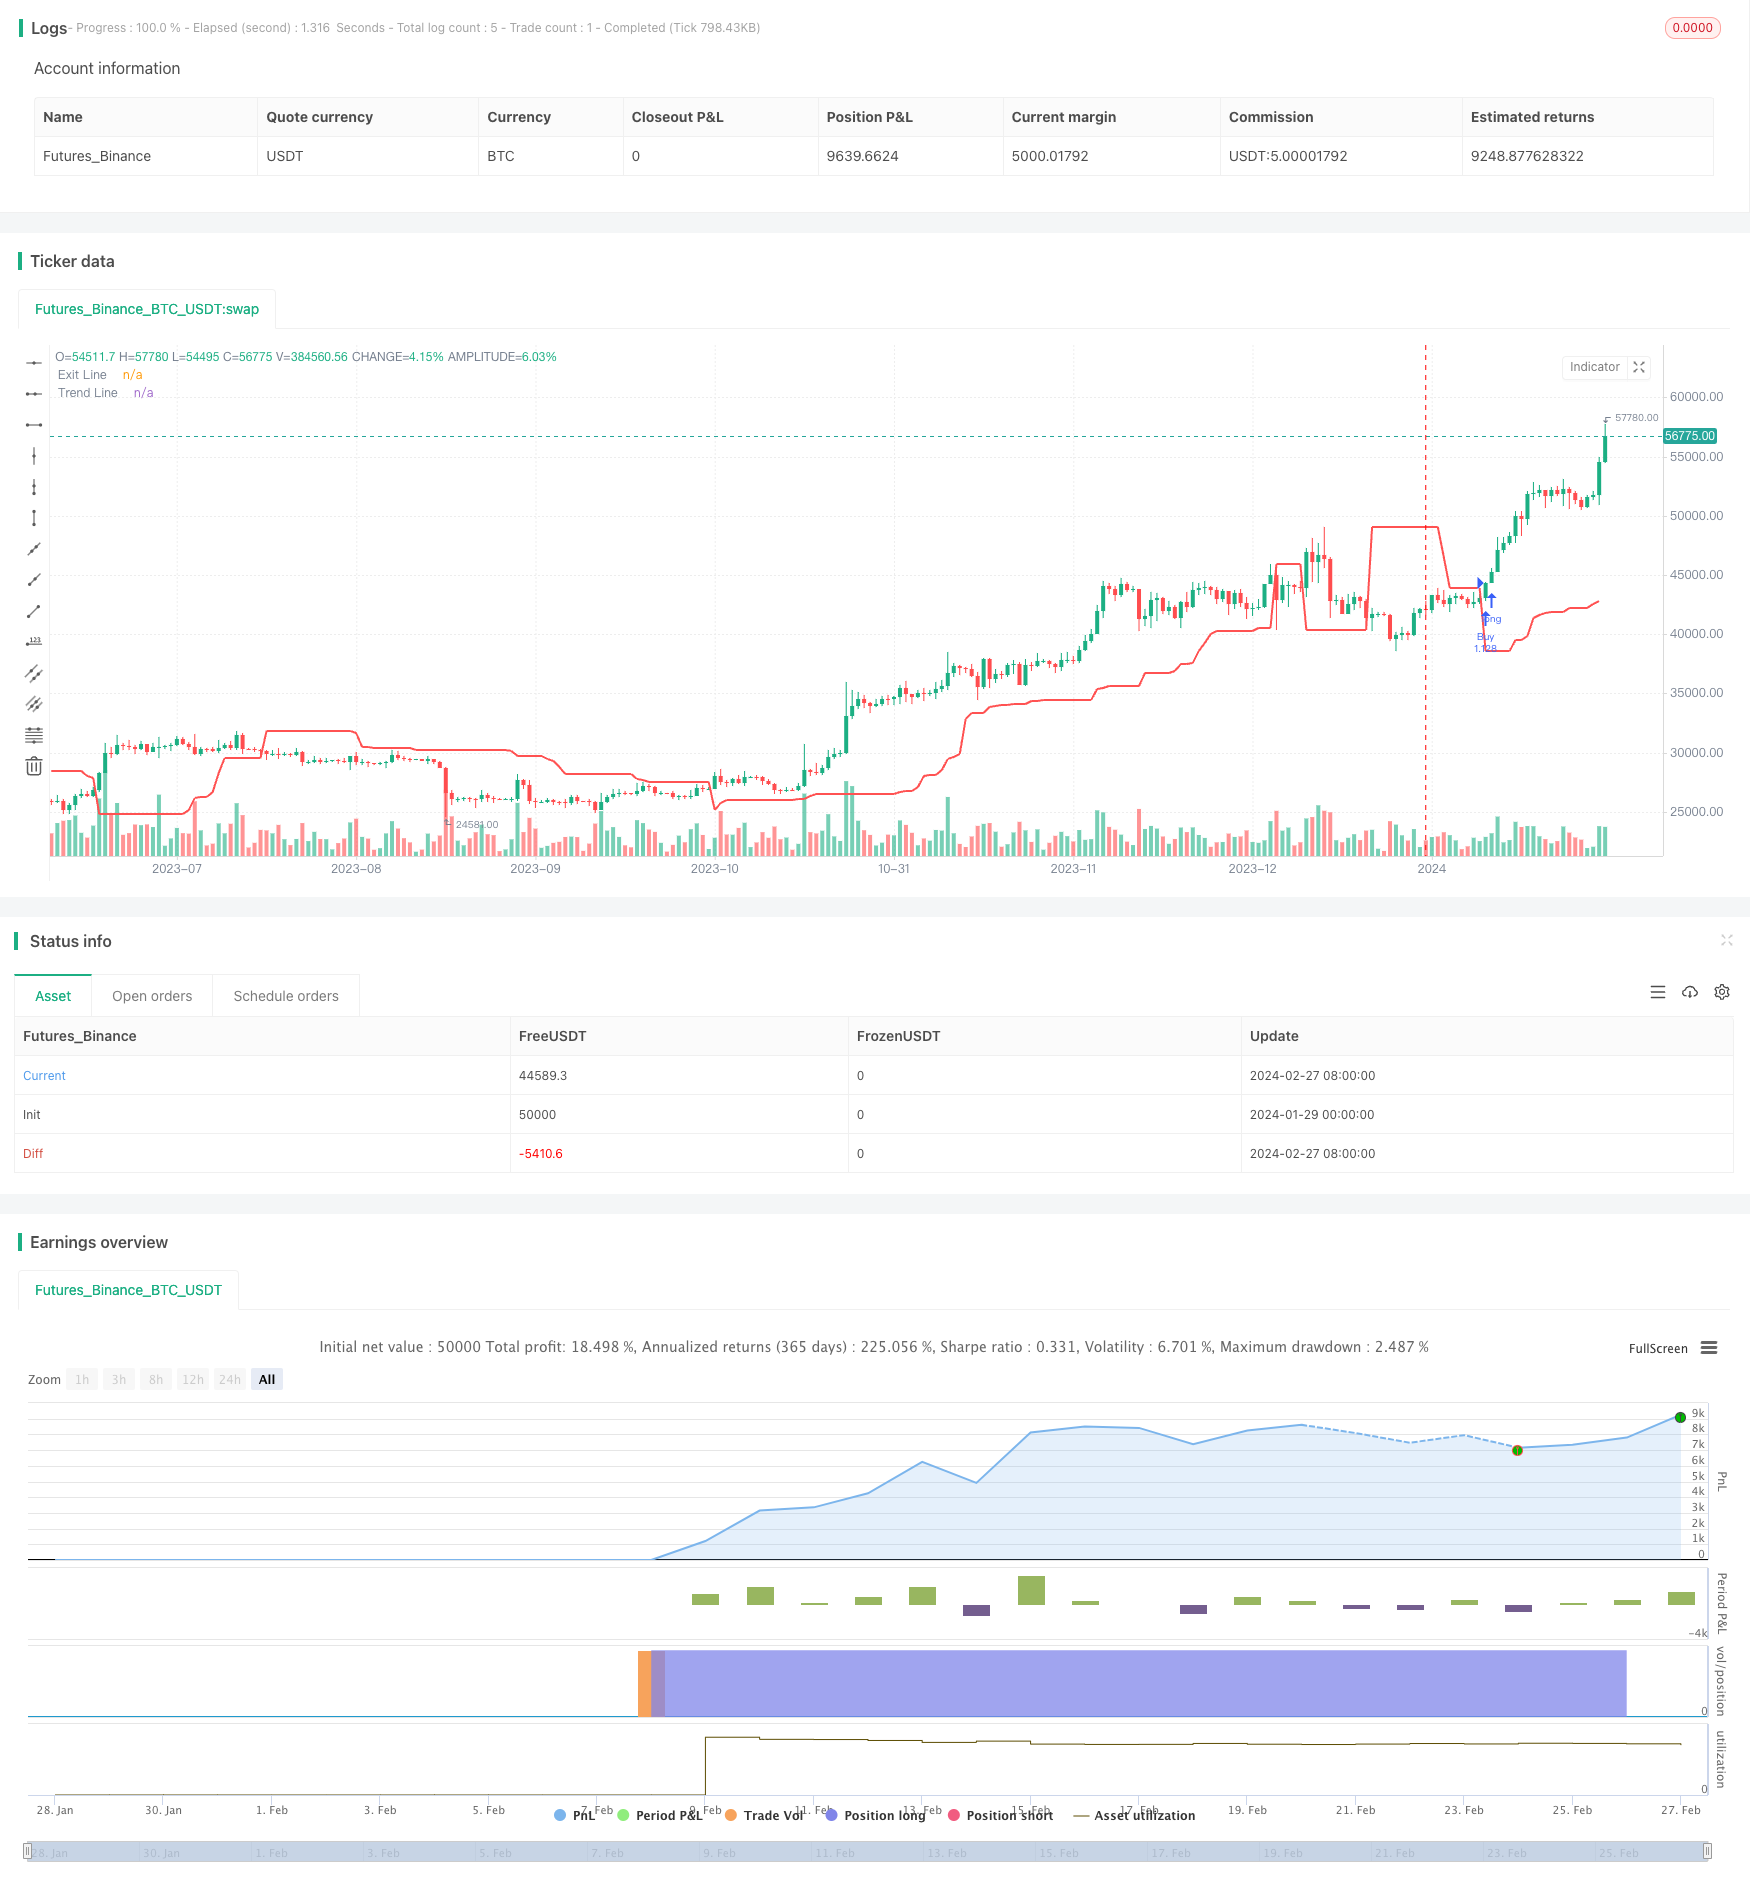
The Adaptive Channel Breakout Strategy is a trend-following strategy that tracks the price channels of the market. It determines the price channels by calculating the highest and lowest prices over a specified period and generates trading signals when prices break out of the channels.
The advantage of this strategy is that it can automatically adapt to market changes by expanding the channels to filter out noise and produce trading signals when a trend is clear. However, there are also risks of chasing high prices and killing low prices. Optimizing parameters can reduce unnecessary trades and improve profitability.
Strategy Logic
This strategy is based on the channel breakout theory. It calculates two sets of highest and lowest prices over different periods (entry length and exit length) to form channels. When prices exceed the channels, signals are generated.
Specifically, the strategy first calculates the 20-period highest price (upper) and lowest price (lower) to form the price channel. It then calculates the 10-period highest price (sup) and lowest price (sdown). After a buy signal is triggered (price breaks above upper rail), the 10-period lowest price (sdown) is used as the stop loss line. After a sell signal is triggered (price breaks below lower rail), the 10-period highest price (sup) is used as the take profit line. This forms an adaptive channel system.
When prices break through the channel, it indicates that a trend is forming. The strategy will then emit trading signals. At the same time, the take profit and stop loss lines will also adjust with price changes to lock in profits and avoid losses.
Advantages
- Automatically adapts to market changes. The channel of this strategy adjusts automatically based on recent prices, Expanding the channel range to filter out noise when a trend starts.
- Trades on strong breakouts. Only enters on upside breakouts or downside breakouts, avoiding chasing high prices and killing low prices.
- Risk control mechanisms. Adopts stop loss and take profit lines based on different periods to flexibly lock in profits and prevent enlarged losses.
- Easy to implement. Only requires two parameters and testdata is easy to obtain, suitable for quantitative trading.
Risk Analysis
The main risks of this strategy include:
- Chasing high and killing low risk. There is risk of buying high and selling low when the channel range is too large. This can be mitigated by optimizing parameters to reduce unnecessary trades.
- Stop loss risk. Fixed-period stop loss lines may be too rigid. Adaptive ATR stop loss can be considered.
- High trading frequency risk. Improper parameter settings may lead to excessively frequent trading. Filter conditions can be added to control trade frequency.
- Market anomaly risk. This strategy judges future trends based on historical data and may fail or lose money when drastic market changes occur.
Optimization
The potential optimizations of this strategy include:
- Add trend indicator filters. Trend indicators like EMA or MACD can be introduced to only take signals when they align with the channel breakout direction.
- Introduce adaptive ATR stop loss. Stop loss lines calculated from average true range can better control single trade loss.
- Optimize parameter combinations. Further improve strategy profitability by finding optimized parameter combinations through more backtests.
- Introduce machine learning techniques. Use neural networks or genetic algorithms to generate dynamic parameters for improved robustness.
Conclusion
The Adaptive Channel Breakout Strategy has clear logic and strong feasibility overall. It can automatically track market changes and generate trading signals when trends form. The dual-channel and stop loss/take profit mechanisms also help control risks. This strategy can be further enhanced in stability and profitability through parameter optimization, filtering conditions, etc. It is worth further live trading verification and refinement.
/*backtest
start: 2024-01-29 00:00:00
end: 2024-02-28 00:00:00
period: 1d
basePeriod: 1h
exchanges: [{"eid":"Futures_Binance","currency":"BTC_USDT"}]
*/

//@version=4
strategy("Turtle Trade Channels Strategy", shorttitle="TTCS", overlay=true, default_qty_type=strategy.percent_of_equity, default_qty_value=100)

length = input(20,"Entry Length", minval=1)
len2=input(10, "Exit Length", minval=1)

lower = lowest(length)
upper = highest(length)

up=highest(high,length)
down=lowest(low,length)
sup=highest(high,len2)
sdown=lowest(low,len2)
K1=barssince(high>=up[1])<=barssince(low<=down[1]) ? down : up
K2=iff(barssince(high>=up[1])<=barssince(low<=down[1]),sdown,sup)
K3=iff(close>K1,down,na)
K4=iff(close<K1,up,na)

buySignal=high==upper[1] or crossover(high,upper[1])
sellSignal = low==lower[1] or crossover(lower[1],low)
buyExit=low==sdown[1] or crossover(sdown[1],low)
sellExit = high==sup[1] or crossover(high,sup[1])

strategy.entry("Buy", strategy.long, when = buySignal and barssince(buySignal) < barssince(sellSignal[1]))
strategy.entry("Sell", strategy.short, when = sellSignal and barssince(sellSignal) < barssince(buySignal[1]))
strategy.exit("Buy Exit", from_entry = "Buy", when = buyExit and barssince(buyExit) < barssince(sellExit[1]))
strategy.exit("Sell Exit", from_entry = "Sell", when = sellExit and barssince(sellExit) < barssince(buyExit[1]))

plot(K1, title="Trend Line", color=color.red, linewidth=2)
e=plot(K2, title="Exit Line", color=color.blue, linewidth=1, style=6)
- The Momentum Burst Tracking Strategy
- Elevated Touch Short Triangle Strategy
- Moving Average Crossover Trend Following Strategy
- Double Confirmation Breakthrough Strategy
- Walnut Trend Following Strategy Based on Distance from 200 EMA
- VWAP Trend Following Strategy
- Turtle Trend Strategy
- Market Reversal Momentum Strategy
- Triple BB Bands Breakout with RSI Strategy
- Dual Moving Average Channel Trading Strategy
- An Advanced EMA Trend Following Strategy with Relaxed RSI and ATR Filters
- Triple Confirmation Trend Tracking Strategy
- Multiple Moving Average Trading Strategy
- Turtle Trading Decision System
- Wave Buying and Selling Reversal 5 Minutes Timeframe Strategy
- RSI-based Auto Trading Strategy
- The Compound Breakout Strategy
- The Momentum Breakout Strategy
- Trend Following Moving Average Strategy
- Momentum Crossover Strategy with Dynamic Trailing Stop Loss