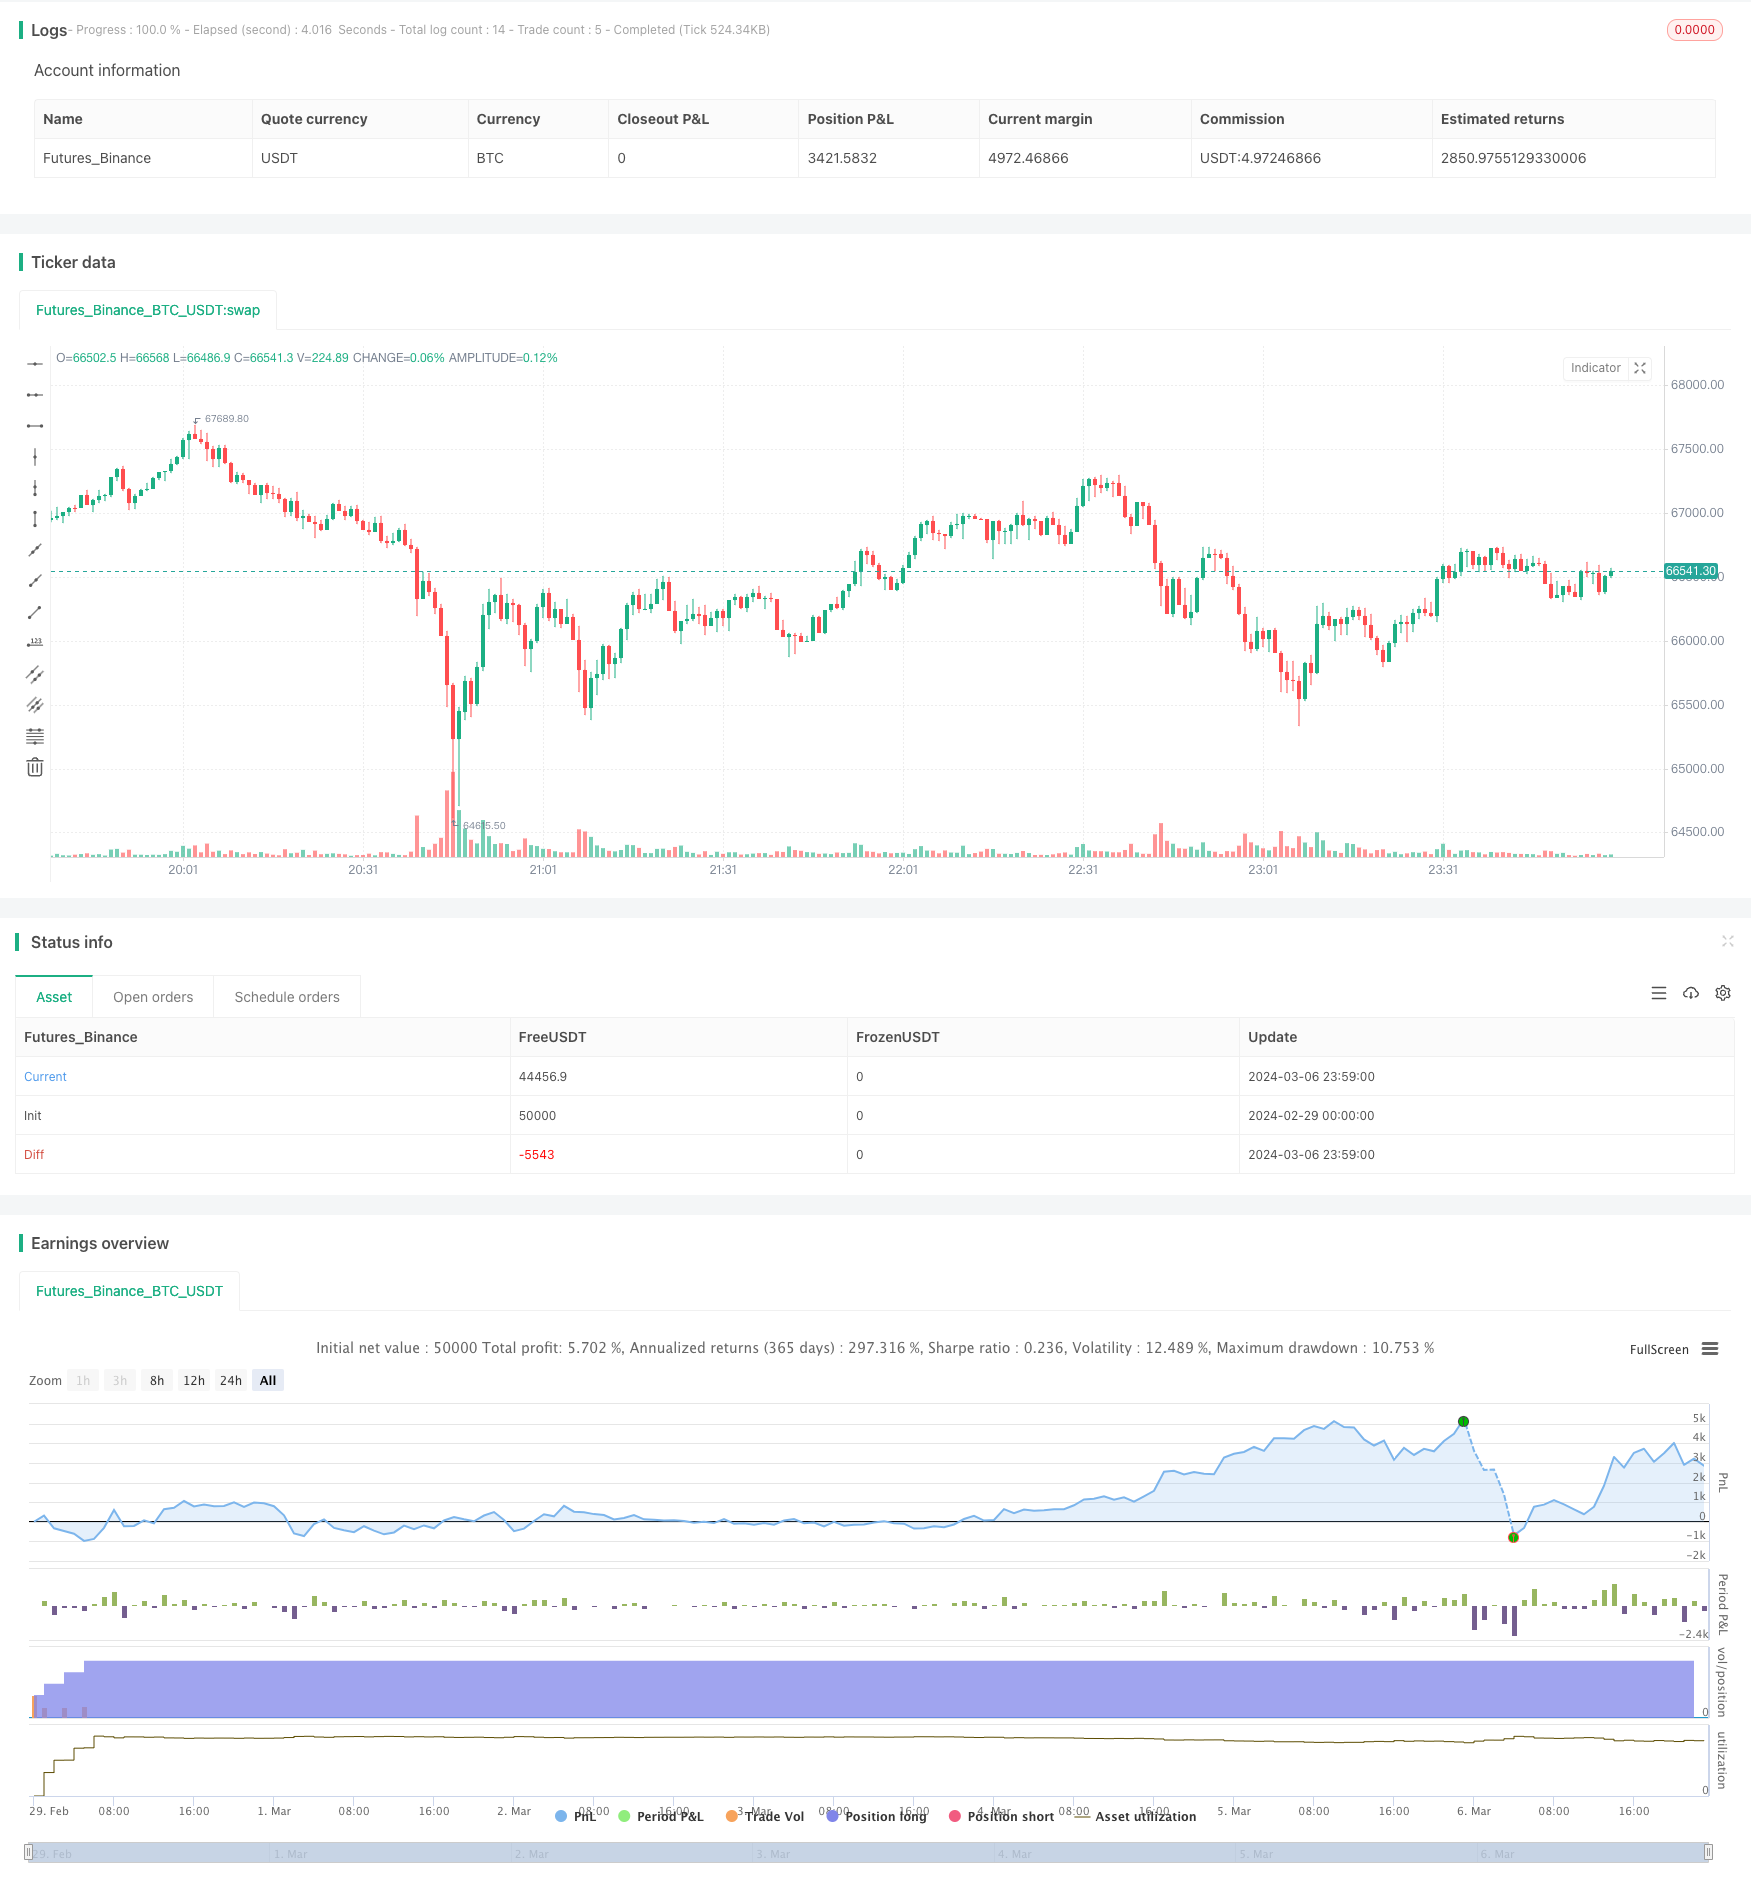
Overview
The Parabolic SAR Trend Tracking Strategy 6.0 is a comprehensive trading strategy that utilizes the Parabolic SAR indicator to generate trading signals based on trend reversals. The strategy is suitable for various financial markets, including cryptocurrencies, stocks, forex, and commodities. It aims to help traders capitalize on market movements in both long and short directions using a systematic approach to enter and exit trades.
Strategy Principles
The strategy is based on the following principles: 1. Calculating the Parabolic SAR indicator using user-defined start, increment, and maximum values. 2. Generating trading signals based on the crossover and crossunder of the closing price and the SAR value. A long signal is generated when the price crosses above the SAR value, while a short signal is generated when the price crosses below the SAR value. 3. Using a 1-hour SAR value as a secondary filter to ensure that trades are only entered when both the immediate SAR and the 1-hour SAR indicators agree on the market direction. 4. Setting entry conditions: long positions are only opened when a long signal is confirmed and the preceding price increase meets the threshold; similarly, short positions are only opened when a short signal is confirmed and the preceding price decrease exceeds the threshold. 5. Setting exit conditions based on two criteria: take profit and stop loss. The take profit condition closes positions when the target profit percentage is reached, securing profits. The stop loss condition closes positions when the price moves against the trade beyond the allowed percentage, minimizing losses.
Advantages
The main advantages of the Parabolic SAR Trend Tracking Strategy 6.0 include: 1. Adaptability to multiple financial markets and different trading styles. 2. Consideration of both immediate SAR and 1-hour SAR, enhancing signal reliability. 3. Built-in take profit and stop loss mechanisms to help control risk. 4. Adjustable parameters, allowing users to optimize according to their needs. 5. Clear logic and easy to understand and implement.
Risk Analysis
Despite the aforementioned advantages, the strategy has some potential risks: 1. During periods of high market volatility, frequent trend reversals may lead to excessive losing trades. 2. Improper parameter settings may result in poor strategy performance. 3. The strategy does not consider important fundamental factors and relies solely on technical indicators. 4. Lack of position sizing and money management considerations. To address these risks, improvements can be made by introducing volatility filters, optimizing parameters, incorporating fundamental analysis, and adding position sizing and money management modules.
Optimization Directions
- Introduce additional technical indicators, such as moving averages and RSI, to improve signal accuracy.
- Optimize entry and exit thresholds to adapt to different market conditions.
- Incorporate position sizing and money management modules to control individual trade risk exposure and overall account risk.
- Consider market volatility and reduce position size or cease trading during increased volatility.
- Incorporate fundamental analysis, such as economic data and significant events, to assist in assessing trend sustainability.
Conclusion
The Parabolic SAR Trend Tracking Strategy 6.0 provides a systematic approach to trend trading. By tracking the Parabolic SAR indicator, the strategy can capture opportunities at trend reversals. The strategy employs strict entry and exit conditions and sets take profit and stop loss rules to manage risk. While the strategy has certain advantages, it also has limitations and potential risks. Future improvements can be made by introducing additional technical indicators, optimizing parameters, enhancing risk management, and incorporating fundamental analysis. These enhancements can improve the strategy’s robustness and profitability. Overall, the Parabolic SAR Trend Tracking Strategy 6.0 offers a trading framework for trend traders to consider, but it requires appropriate adjustments and optimizations based on individual circumstances when applied in practice.
/*backtest
start: 2024-02-29 00:00:00
end: 2024-03-07 00:00:00
period: 1m
basePeriod: 1m
exchanges: [{"eid":"Futures_Binance","currency":"BTC_USDT"}]
*/

//@version=5
strategy("SAR Trend 6.0", default_qty_type = strategy.percent_of_equity, default_qty_value =20, initial_capital=500, commission_type=strategy.commission.percent, commission_value=0.08, pyramiding=5 )

// Parabolic SAR Parameters
start = input(0.02, title="Start Value")
increment = input(0.02, title="Increment Value")
maximum = input(0.2, title="Maximum Value")
long_win=input(0.1,title = "Preceding Increase for Long (%)")/100
short_win=input(2,title = "Preceding Decrease for Short (%)")/100
lose_pct=input (0.5, title="Stop Loss Percentage")
win_pct_long=input(0.2,title = "Take Profit for Long Positions")
win_pct_short=input(0.1,title = "Take Profit for Short Positions")
start1 = input(0.02, title="Start Value (1H)")
increment1 = input(0.02, title="Increment Value (1H)")
maximum1 = input(0.2, title="Maximum Value (1H)")

// Calculating Parabolic SAR
sarValue = ta.sar(start, increment, maximum)

// Generating Trading Signals
longSignal = ta.crossover(close, sarValue)
shortSignal = ta.crossunder(close, sarValue)

// Get Parabolic SAR value for 1-hour time frame
sarValue_1h = request.security(syminfo.tickerid, "5", ta.sar(start1, increment1, maximum1)[1])

// Generating Trading Signals
longSignal1 = close > sarValue_1h
shortSignal1 = close < sarValue_1h

if longSignal and (close - open)/open > long_win and longSignal1
    strategy.entry("Long", strategy.long)
if shortSignal and (open - close)/open > short_win and shortSignal1
    strategy.entry("Short", strategy.short)

if strategy.position_size > 0 and shortSignal and (close - strategy.position_avg_price)/strategy.position_avg_price > win_pct_long
    strategy.close_all("Take Profit")

if strategy.position_size < 0 and longSignal and (strategy.position_avg_price - close)/strategy.position_avg_price > win_pct_short
    strategy.close_all("Take Profit")

if strategy.position_size > 0 and (strategy.position_avg_price - close)/strategy.position_avg_price > lose_pct
    strategy.close_all("Stop Loss")

if strategy.position_size < 0 and (close - strategy.position_avg_price)/strategy.position_avg_price > lose_pct
    strategy.close_all("Stop Loss")