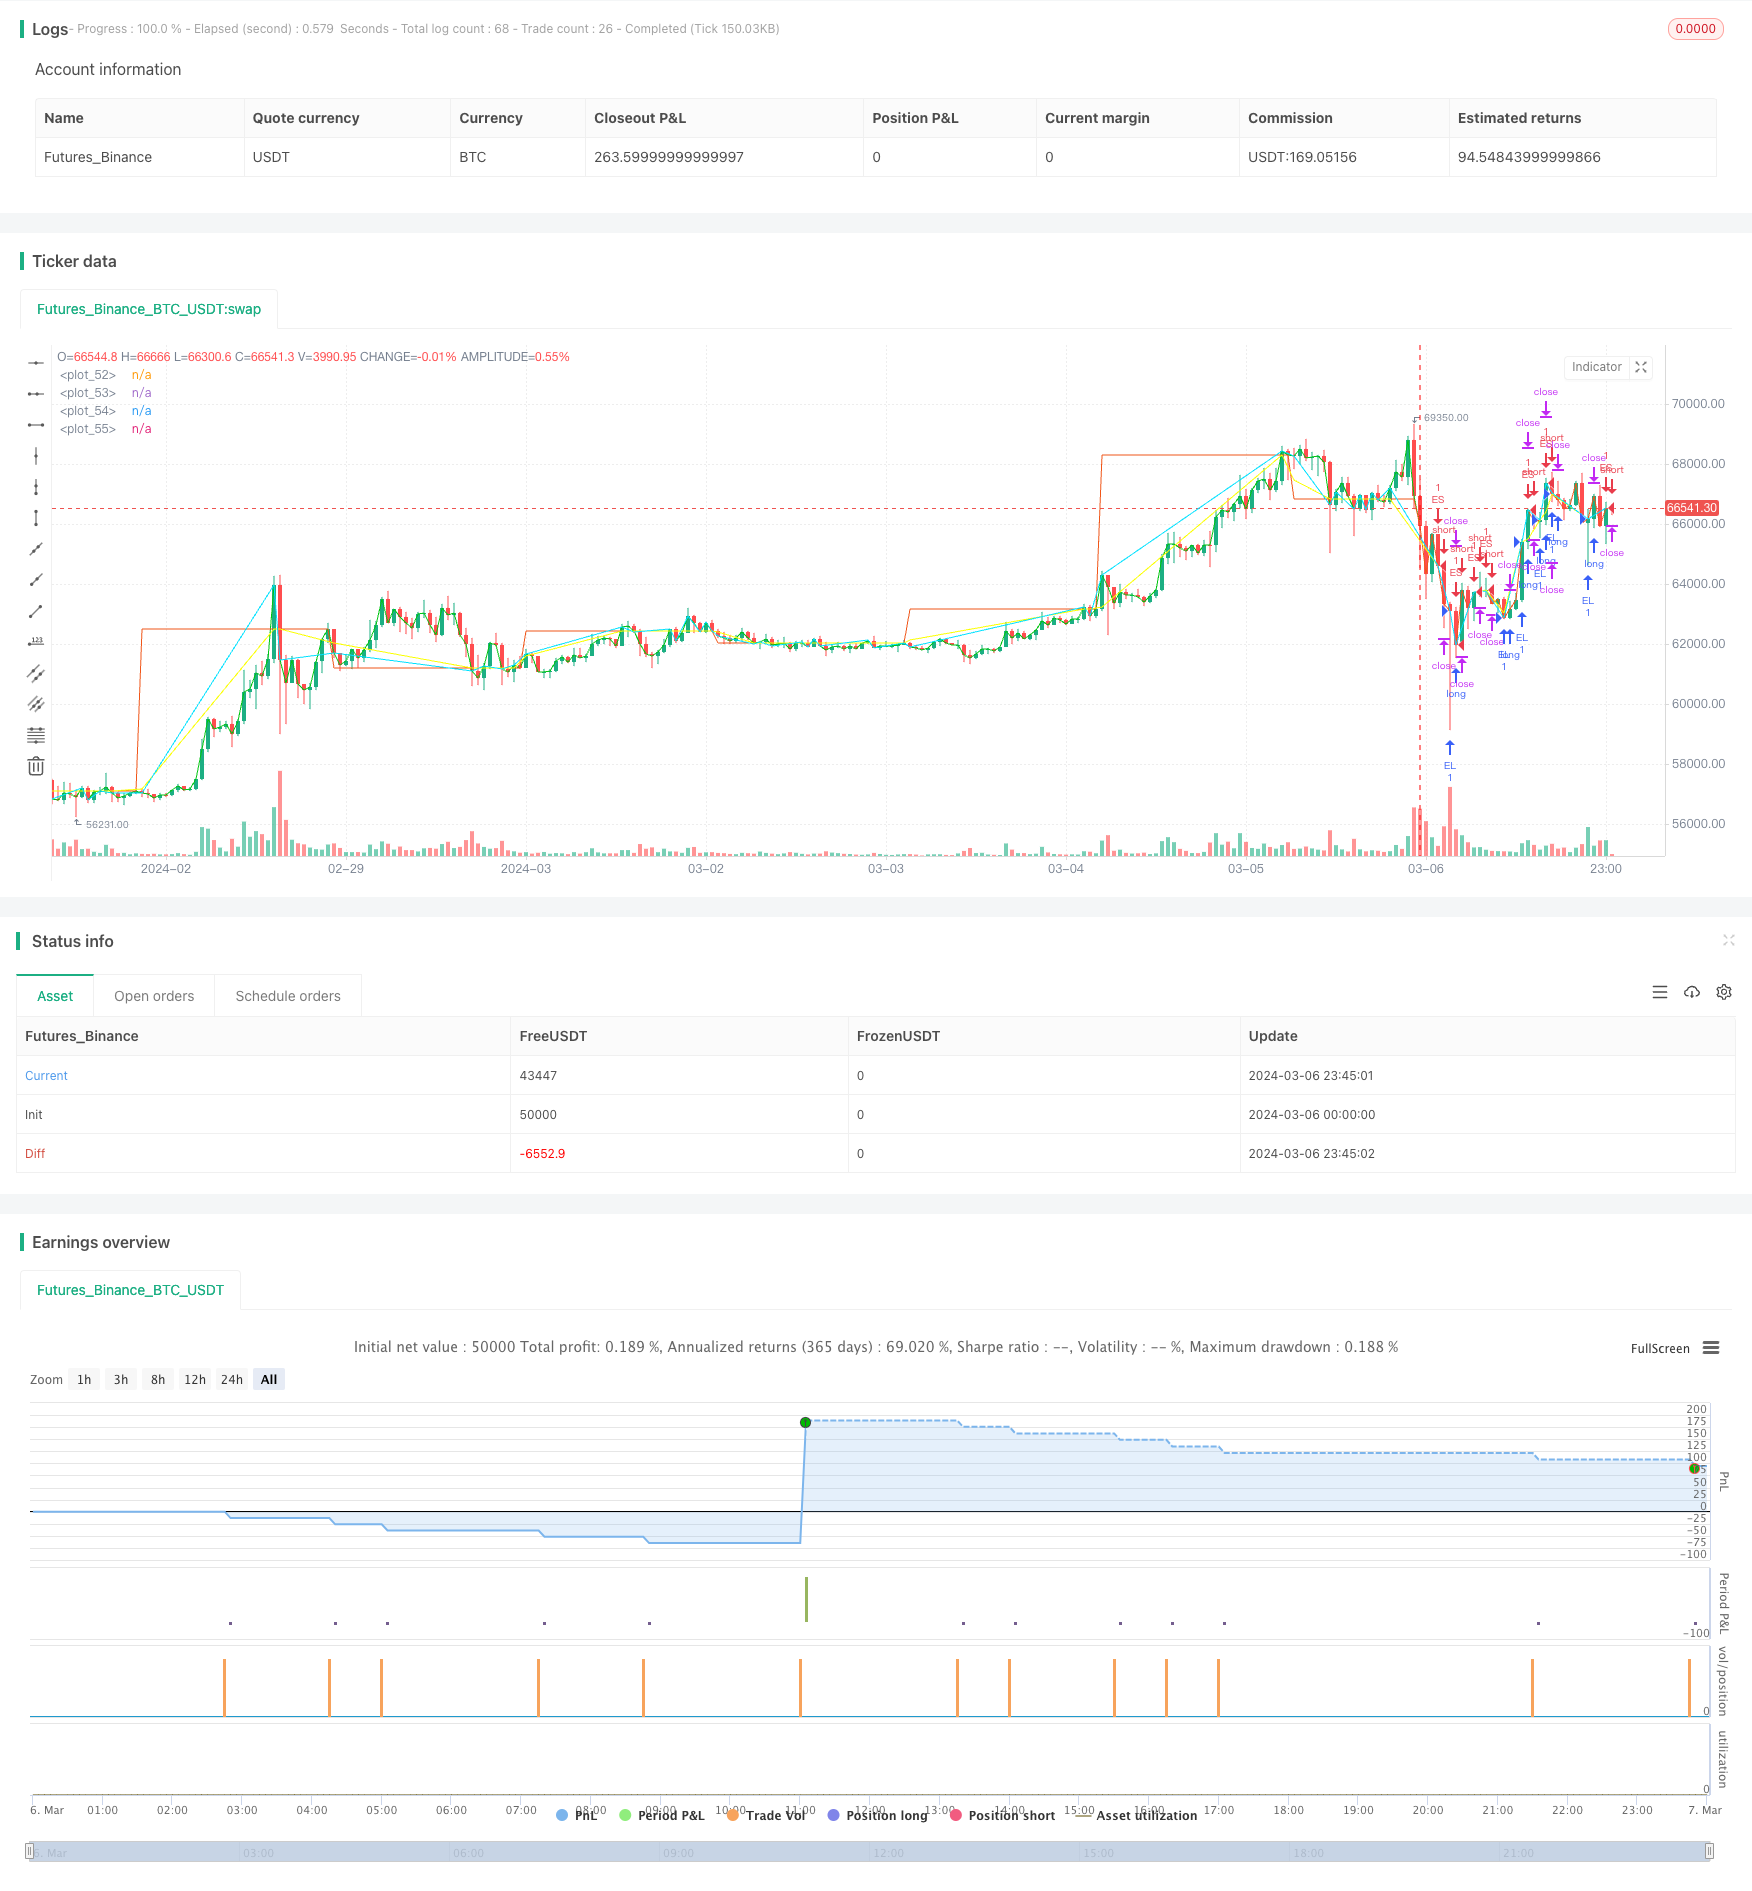
基于VWAP和跨周期信号的多空动态止盈止损策略
Author: ChaoZhang, Date: 2024-03-08 17:37:21Tags:

概述
该策略使用日线的VWAP(成交量加权平均价)作为进场和出场的信号。当收盘价上穿VWAP时触发做多,止损设置在VWAP下方的前一根K线低点,目标价设置在开仓价上方3个点;当收盘价下穿VWAP时触发做空,止损设置在VWAP上方的前一根K线高点,目标价设置在开仓价下方3个点。该策略没有包含出场条件,交易会一直持有直到反向信号出现。
策略原理
- 获取日线的VWAP数据,作为趋势判断和交易信号的依据。
- 判断当前收盘价是否上穿/下穿VWAP,分别作为做多和做空的触发条件。
- 做多时,如果前一根K线低点在VWAP之下,则将其作为止损位,否则直接使用VWAP作为止损;做空则相反。
- 开仓后,分别设置固定3个点的止盈位。
- 策略持续运行,直到触发反向信号平仓并开立新的仓位。
通过跨周期的VWAP数据判断趋势,同时利用动态止损和固定点数止盈,可以有效把握趋势行情,控制回撤风险,并及时锁定利润。
优势分析
- 简单有效:策略逻辑清晰,仅使用VWAP一个指标,就可以实现趋势判断和信号触发,简单易于实现和优化。
- 动态止损:根据前一根K线的高低点设置止损,可以更好地适应市场波动,降低风险。
- 固定点数止盈:以固定点数设置目标价,有助于及时锁定利润,避免利润回吐。
- 及时止损止盈:策略在触发反向信号时会立即平仓,不会对已有利润造成额外损失,同时会开立新的仓位,捕捉新的趋势行情。
风险分析
- 参数优化:策略使用了固定的3个点作为止盈,实际交易中可能需要根据不同标的和市场特点进行优化,选择最佳参数。
- 震荡行情:在震荡行情下,频繁的进场和出场可能导致较高的交易成本,影响收益。
- 趋势持续性:策略依赖于趋势行情,如果市场处于区间震荡,或趋势持续性较差,可能会出现较多的交易信号,带来更多的风险。
优化方向
- 趋势过滤:加入其他趋势指标如移动平均线、MACD等,对趋势进行二次确认,提高信号可靠性。
- 动态止盈:根据市场波动性、ATR等指标,动态调整止盈点数,以更好地适应市场。
- 仓位管理:根据账户资金、风险偏好等因素,对每次交易的仓位大小进行动态调整。
- 交易时段选择:根据标的特性和交易活跃程度,选择最佳的交易时段,提高策略效率。
总结
该策略利用跨周期VWAP数据进行趋势判断和信号触发,同时采用动态止损和固定点数止盈的方式控制风险和锁定利润,是一个简单有效的量化交易策略。通过趋势过滤、动态止盈、仓位管理和交易时段选择等方面的优化,可以进一步提高策略的稳健性和收益潜力。但在实际应用中,仍需注意市场特点、交易成本和参数优化等因素,以期获得更好的策略表现。
/*backtest
start: 2024-03-06 00:00:00
end: 2024-03-07 00:00:00
period: 45m
basePeriod: 5m
exchanges: [{"eid":"Futures_Binance","currency":"BTC_USDT"}]
*/

//@version=5
strategy('Pine Script Tutorial Example Strategy 1', overlay=true, initial_capital=1000, default_qty_value=100, default_qty_type=strategy.percent_of_equity)
// fastEMA = ta.ema(close, 24)
// slowEMA = ta.ema(close, 200)
// Higher Time Frame
float sl = na
float tgt = na
posSize = 1
vwap_1d = request.security(syminfo.tickerid, "1D", ta.vwap(close))
// plot(vwap_1d)

// To avoid differences on historical and realtime bars, you can use this technique, which only returns a value from the higher timeframe on the bar after it completes:
// indexHighTF = barstate.isrealtime ? 1 : 0
// indexCurrTF = barstate.isrealtime ? 0 : 1
// nonRepaintingVWAP = request.security(syminfo.tickerid, "1D", close[indexHighTF])[indexCurrTF]
// plot(nonRepaintingVWAP, "Non-repainting VWAP")

enterLong = ta.crossover(close, vwap_1d)
exitLong  = ta.crossunder(close, vwap_1d)

enterShort = ta.crossunder(close, vwap_1d)
exitShort  = ta.crossover(close, vwap_1d)

if enterLong
    sl := low[1]>vwap_1d ?low[1]:vwap_1d
    tgt:=close+3
    strategy.entry("EL", strategy.long, qty=posSize)
    strategy.exit('exitEL', 'EL', stop=sl, limit=tgt)
if enterShort
    sl := high[1]<vwap_1d ?high[1]:vwap_1d
    tgt := close-3
    strategy.entry("ES", strategy.short, qty=posSize)
    strategy.exit('exitES', 'ES', stop=sl, limit=tgt)

// if exitLong
//     strategy.close("EL")
// if exitShort
//     strategy.close("ES")


// goLongCondition1 = ta.crossover(close, vwap_1d)
// timePeriod = time >= timestamp(syminfo.timezone, 2021, 01, 01, 0, 0)
// notInTrade = strategy.position_size <= 0
// if goLongCondition1 and timePeriod and notInTrade
//     stopLoss = low[1]
//     takeProfit = close+3
//     strategy.entry('long', strategy.long)
//     strategy.exit('exit', 'long', stop=stopLoss, limit=takeProfit)
plot(close, color=color.new(#00c510, 0))
plot(vwap_1d, color=color.new(#f05619, 0))
plot(sl, color=color.new(#fbff00, 0))
plot(tgt, color=color.new(#00e1ff, 0))
更多内容
- 基于布林带和RSI的多头摆动交易策略
- 基于平均价海金阿什烛台与相对强弱指数的动态调仓策略
- 均线与超级趋势结合的日内多空动态平衡策略
- 基于超级趋势和MACD的风险控制策略
- 基于UT Bot指标的ATR移动止损策略
- G-Channel与EMA结合的趋势跟踪策略
- 布林带与移动平均线结合的相对强弱指标交易策略
- 基于动量顺势策略
- 基于随机力矩指标的量化交易策略
- 基于支撑阻力和动量指标的多时间框架趋势跟踪策略
- 基于EMA和随机RSI的多周期趋势跟踪交易策略
- 基于价格波动范围的买卖信号过滤策略
- 连续阴跌-阳涨反转策略
- 抛物线SAR趋势跟踪策略 6.0
- 布林带与随机指标KD交叉策略
- 基于随机RSI和EMA交叉的加密货币回调交易策略
- 基于VWAP和OBV RSI指标的BabyShark交易策略
- 比特币动量跟踪止损策略
- 基于多阶段布林带和MACD指标的量化交易策略
- MACD均线多头量化交易策略