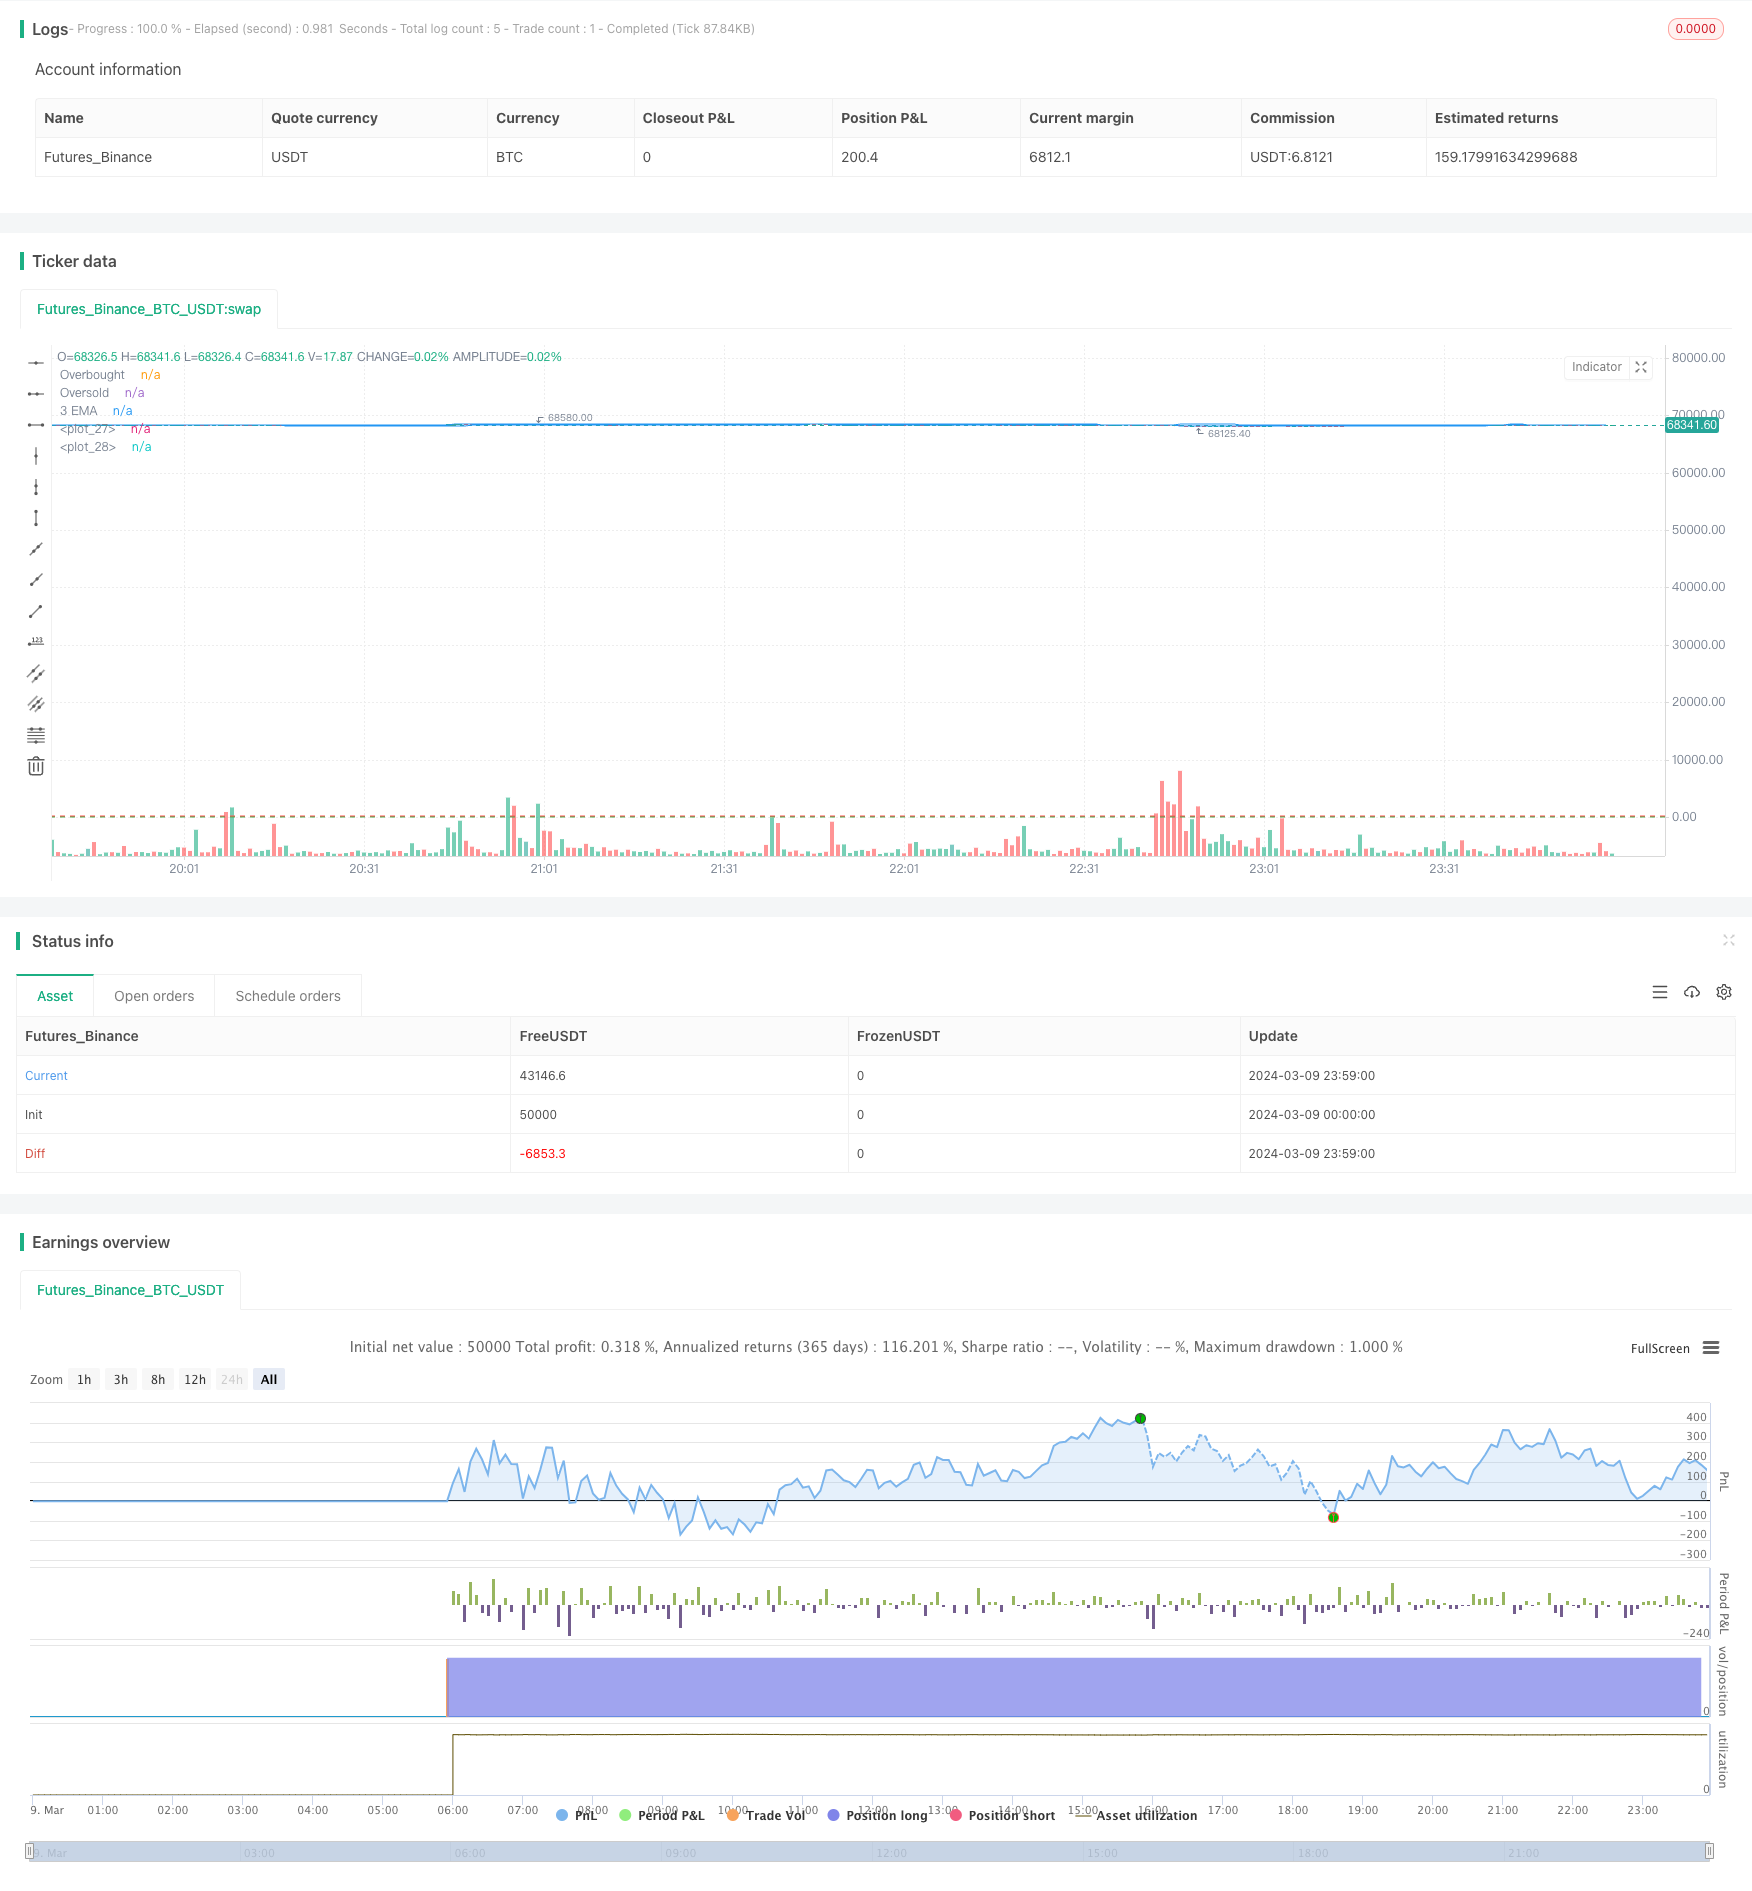
布林带与移动平均线结合的相对强弱指标交易策略
Author: ChaoZhang, Date: 2024-03-11 11:02:44Tags:

概述
该策略利用布林带、3日指数移动平均线(EMA)和相对强弱指标(RSI)三个技术指标,结合它们的交叉信号,构建了一个完整的交易系统。当价格突破布林带下轨,同时突破3日EMA,且RSI低于30时,产生买入信号;当价格突破布林带上轨,同时跌破3日EMA,且RSI高于70时,产生卖出信号。
策略原理
布林带由三条线组成:中轨是价格的移动平均线,上下两条带状线通过价格的标准差计算得出。它主要用于衡量市场的波动性,识别超买和超卖状态。
3日EMA是基于最近3天收盘价计算的指数移动平均线,能够快速响应价格变化,是一个短期趋势跟踪指标。
RSI衡量一定时期内股票价格变动的幅度和速度,来评估股票的超买超卖现象。当RSI小于30时,提示超卖;RSI大于70时,提示超买。
策略逻辑为:
- 当收盘价上穿布林带下轨,同时上穿3日EMA,且RSI小于30时,认为股票可能即将反转上涨,产生买入信号。
- 当收盘价下穿布林带上轨,同时下穿3日EMA,且RSI大于70时,认为股票可能即将反转下跌,产生卖出信号。
- 同时满足布林带、EMA、RSI三个指标的信号,可以有效过滤掉很多假信号,提高交易准确性。
优势分析
布林带能够量化市场波动,3日EMA紧随价格变动,RSI能判断超买超卖,三个指标互为补充,构成了一个稳健的交易系统。
同时结合三个指标的信号,严格的交易条件可以避免频繁交易,从而减少交易成本。
在趋势行情和震荡行情中都可以捕捉到较好的交易机会,适用性较强。
代码思路清晰,可解释性强,便于理解和优化。
风险分析
在单边趋势行情中,该策略交易频率可能较低,错失一些趋势利润。
对于日内波动剧烈的行情,交易信号可能会出现稍微滞后。
策略参数的选择对于交易结果会有明显影响,需要根据不同标的和市场特点进行优化。
策略未设置止损和止盈,在行情剧烈波动时,可能承担较大风险。
针对上述风险,可以考虑引入趋势判断指标来改善趋势行情的表现,优化信号计算时的数据频率,深入分析参数的最优区间,以及设置合理的止盈止损条件等。
优化方向
引入更多有效的技术指标,如趋势类指标MACD等,在震荡行情和趋势行情中都能有效捕捉交易机会。
优化参数选择,通过对历史数据进行全面的回测,找到最优的参数组合,提高策略稳定性和收益率。
考虑加入仓位管理和资金管理规则,控制单次交易的资金比例,以及动态调整仓位,更好地控制风险。
设置合理的止盈止损条件,减少单次交易的最大亏损,让盈利单能够充分获利。
针对不同市场状况,设计应对机制,如震荡行情中减少交易频率,趋势行情中提高持仓时间等。
通过以上优化,可以进一步提升该策略的风险收益比,更好地适应多变的市场环境。
总结
本文介绍了一个基于布林带、3日EMA和RSI指标的交易策略。该策略通过三个指标的交叉信号,构建了严格的买卖条件,能够有效过滤掉大部分假信号。策略思路清晰,适用于趋势和震荡行情,具有广泛的适用性。但是该策略也存在一些局限性,如趋势行情中交易频率低,缺乏仓位管理和止损止盈机制等。因此,还需要在实践中不断优化和完善,以期获得更加稳健的交易表现。总的来说,该策略提供了一个基于多指标交叉的交易框架,为量化交易者提供了新的思路。在此基础上,可以灵活调整指标选择和参数设置,开发出更多适应不同市场的量化策略,丰富量化交易的策略库。
/*backtest
start: 2024-03-09 00:00:00
end: 2024-03-10 00:00:00
period: 1m
basePeriod: 1m
exchanges: [{"eid":"Futures_Binance","currency":"BTC_USDT"}]
*/

//@version=5
strategy("Custom Strategy", overlay=true)

// Input parameters
length = input(20, title="Bollinger Bands Length")
src = input(close, title="Source")
mult = input(2.0, title="Bollinger Bands Multiplier")

// Bollinger Bands
basis = ta.sma(src, length)
upper_band = basis + mult * ta.stdev(src, length)
lower_band = basis - mult * ta.stdev(src, length)

// 3 EMA
ema3 = ta.ema(close, 3)

// RSI
rsi_length = input(14, title="RSI Length")
rsi_source = close
rsi_value = ta.rsi(rsi_source, rsi_length)

// Strategy logic
strategy.entry("Buy", strategy.long, when=ta.crossover(close, lower_band) and ta.crossover(close, ema3) and rsi_value < 30)
strategy.entry("Sell", strategy.short, when=ta.crossover(close, upper_band) and ta.crossunder(close, ema3) and rsi_value > 70)

// Plotting
plot(upper_band, color=color.blue)
plot(lower_band, color=color.blue)
plot(ema3, color=color.green, title="3 EMA")
hline(70, "Overbought", color=color.red)
hline(30, "Oversold", color=color.green)
- 多重指数移动平均线交易策略
- 基于RSI 穿越交易策略
- 基于双均线交叉策略
- 基于ATR与SMA的动态止损追踪策略
- 基于布林带和RSI的多头摆动交易策略
- 基于平均价海金阿什烛台与相对强弱指数的动态调仓策略
- 均线与超级趋势结合的日内多空动态平衡策略
- 基于超级趋势和MACD的风险控制策略
- 基于UT Bot指标的ATR移动止损策略
- G-Channel与EMA结合的趋势跟踪策略
- 基于动量顺势策略
- 基于随机力矩指标的量化交易策略
- 基于支撑阻力和动量指标的多时间框架趋势跟踪策略
- 基于VWAP和跨周期信号的多空动态止盈止损策略
- 基于EMA和随机RSI的多周期趋势跟踪交易策略
- 基于价格波动范围的买卖信号过滤策略
- 连续阴跌-阳涨反转策略
- 抛物线SAR趋势跟踪策略 6.0
- 布林带与随机指标KD交叉策略
- 基于随机RSI和EMA交叉的加密货币回调交易策略