Multi-Period Moving Average Crossover Trend Following Strategy
Author: ChaoZhang, Date: 2024-07-30 10:54:14Tags: EMAMASMASMMARMAWMAVWMA
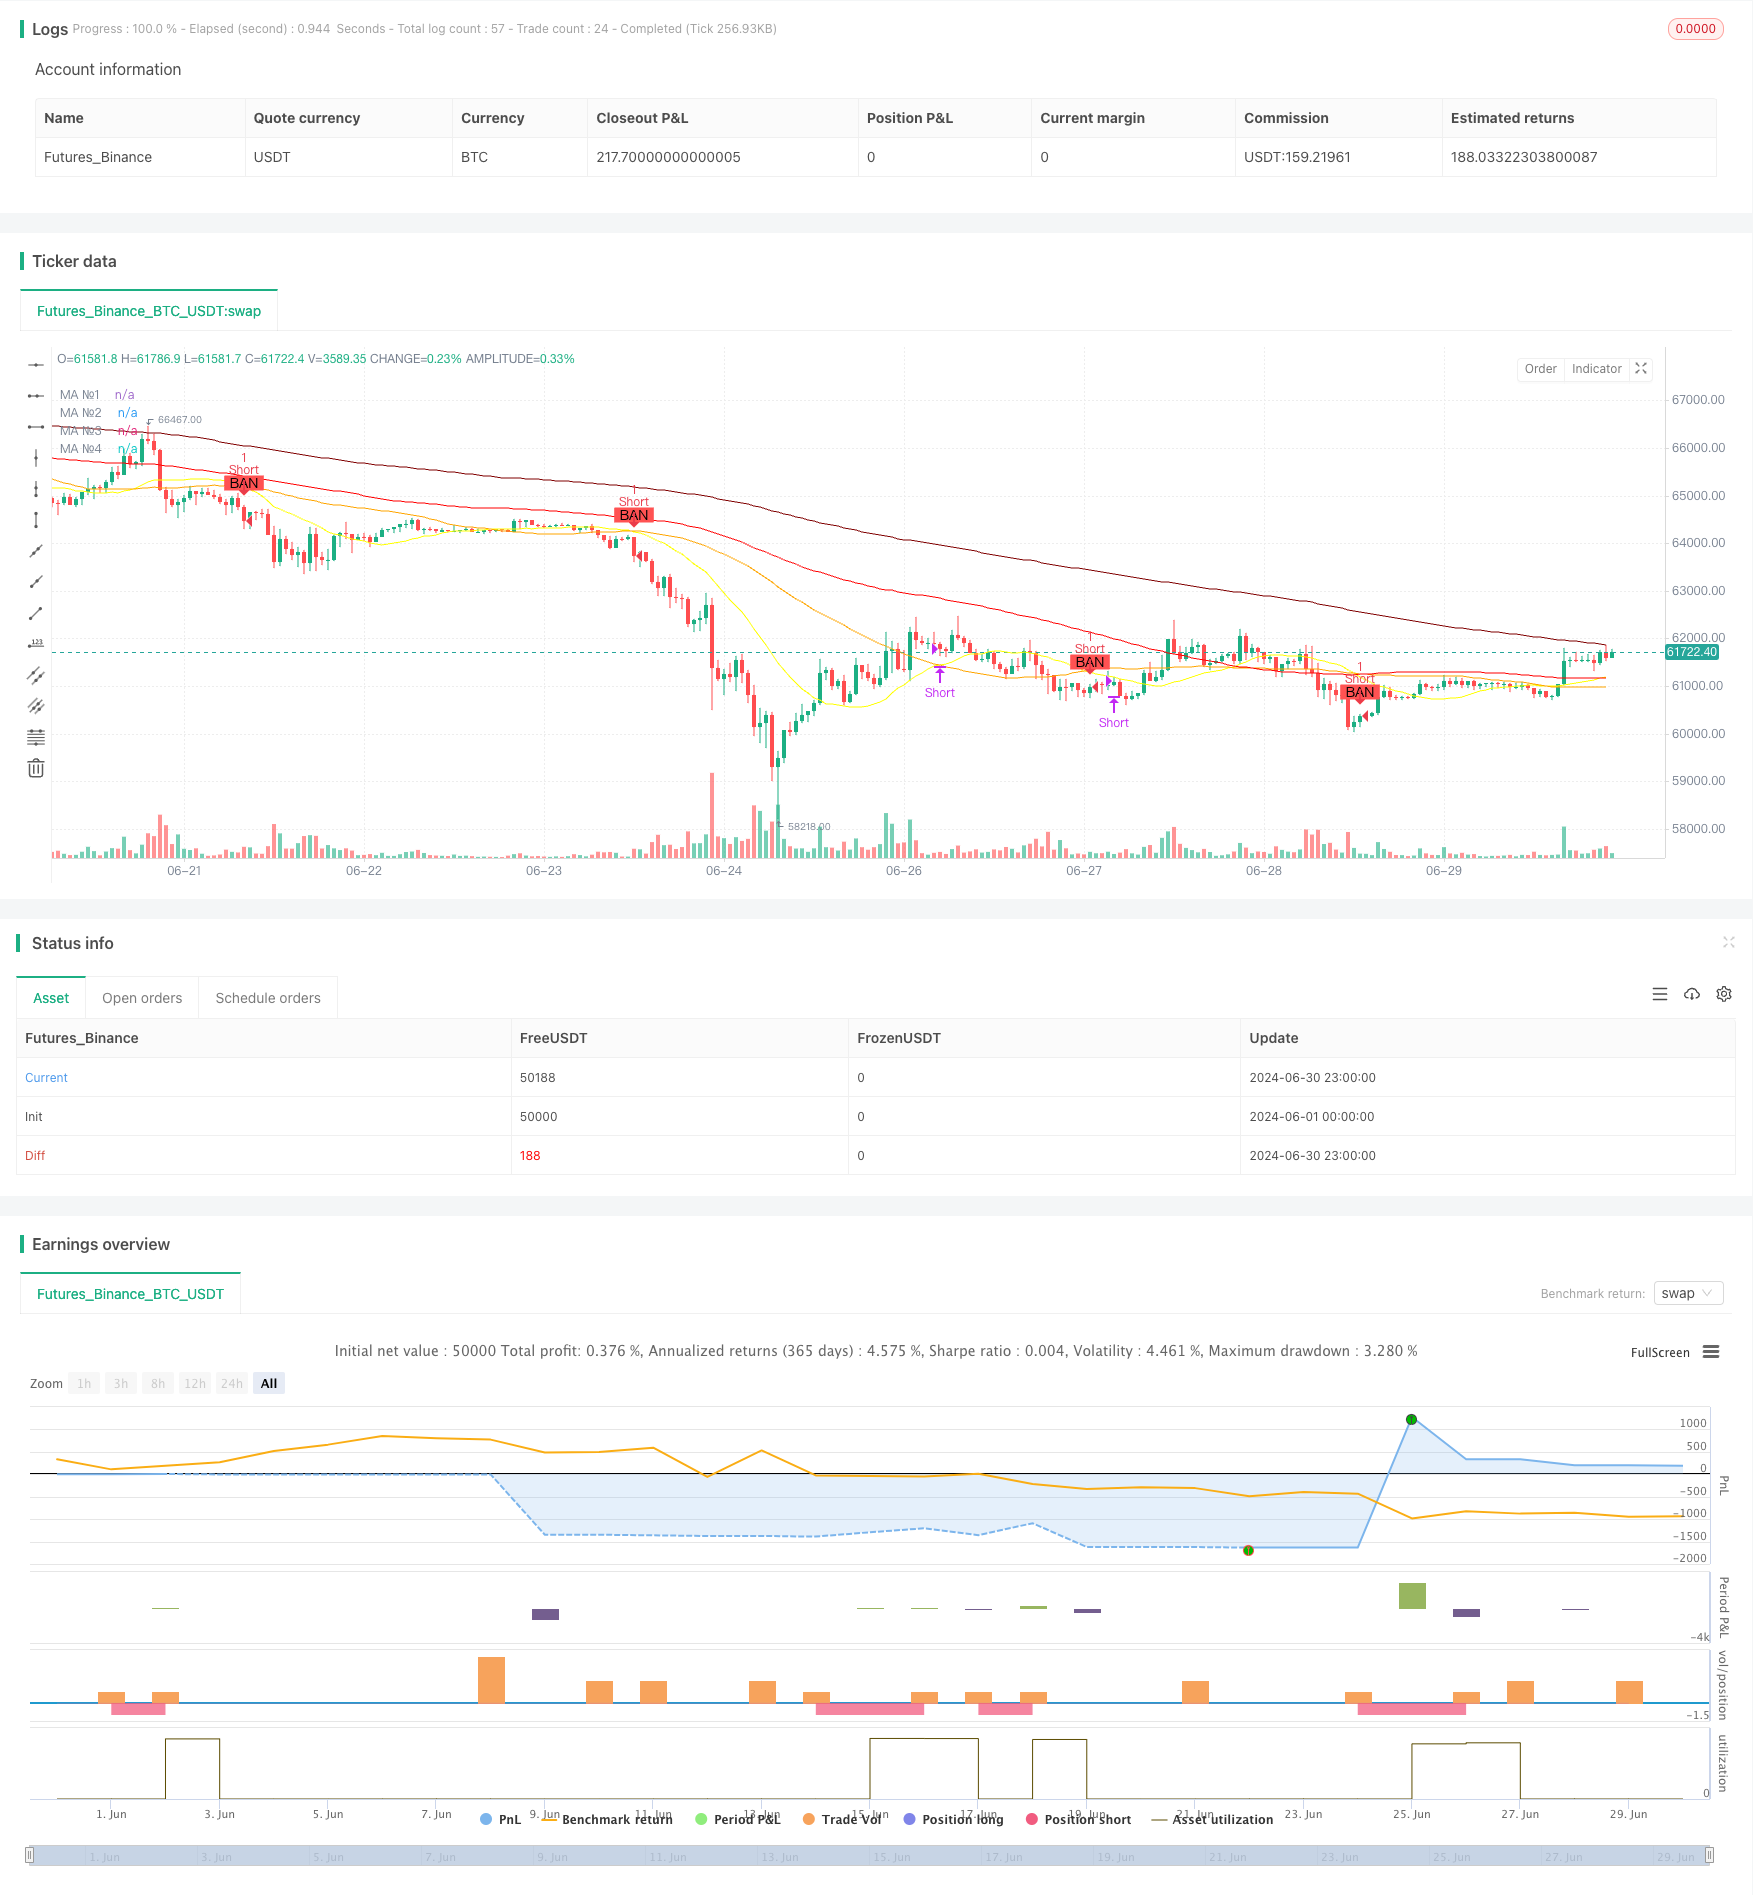
Overview
This strategy is a trend-following trading system based on multi-period moving average crossovers. It utilizes four moving averages of different periods to identify market trends and generates trading signals when the short-term moving average crosses the medium-term moving average. The strategy also incorporates risk management mechanisms by setting stop-losses to control downside risk. This approach aims to capture medium to long-term market trends while filtering out short-term market noise through the combination of multiple moving averages.
Strategy Principles
The core principle of this strategy is to use crossovers of multiple moving averages to determine changes in market trends. Specifically:
- It uses four moving averages: MA1 (20 periods), MA2 (50 periods), MA3 (100 periods), and MA4 (200 periods).
- A buy signal is generated when MA1 crosses above MA2 and the closing price is above MA4.
- A sell signal is generated when MA1 crosses below MA2 and the closing price is below MA4.
- After entry, a stop-loss is set at the lowest price (for long positions) or highest price (for short positions) at the entry point.
- The position is closed when an opposite crossover signal occurs or the stop-loss is hit.
This design leverages the sensitivity of the short-term moving average (MA1) to market changes while using the medium-term (MA2) and long-term (MA4) moving averages to confirm the overall trend, thereby reducing the risk of false breakouts.
Strategy Advantages
Strong trend-following capability: The combination of multiple moving averages effectively captures medium to long-term market trends, reducing the impact of short-term fluctuations.
Robust risk management: The dynamic stop-loss mechanism helps control the risk exposure for each trade.
High flexibility: The strategy allows users to customize the type and parameters of moving averages, enabling optimization for different markets and trading instruments.
Good visualization: Traders can intuitively observe market conditions and trading signals through different colored moving averages and background markers.
High adaptability: The strategy can be applied to various time frames and trading instruments, demonstrating broad applicability.
High degree of automation: The strategy can be fully automated, reducing human emotional interference.
Strategy Risks
Lag: Moving averages are inherently lagging indicators, which may result in significant drawdowns during early trend reversals.
Ineffective in ranging markets: Frequent moving average crossovers in sideways markets may lead to overtrading and consecutive losses.
False breakout risk: Despite using multiple moving averages for confirmation, false signals may still occur during short-term fluctuations.
Potentially strict stop-loss settings: Using the highest/lowest price at entry as a stop-loss may result in premature exits in volatile markets.
Ignores other market factors: Relying solely on price and moving averages, the strategy doesn’t consider other important factors such as volume and fundamentals.
Parameter sensitivity: Different moving average parameters can lead to significantly different results, posing a risk of overfitting.
Strategy Optimization Directions
Introduce dynamic stop-losses: Consider using ATR (Average True Range) to set more reasonable stop-loss levels that adapt to changes in market volatility.
Add trend strength filtering: Incorporate indicators like ADX (Average Directional Index) to measure trend strength and only enter positions in strong trend markets.
Consider volume factors: Use volume as a confirmation condition for trading signals to improve signal reliability.
Optimize entry timing: Wait for a confirmation period after moving average crossovers or combine with other technical indicators (such as RSI) to optimize entry points.
Add trailing stop-losses: Implement trailing stops to capture more profit in sustained trends.
Parameter adaptation: Consider using adaptive parameter methods, such as dynamically adjusting moving average periods based on market volatility.
Integrate fundamental analysis: Adjust strategy behavior during important economic data releases or special events to address potential abnormal fluctuations.
Conclusion
The multi-period moving average crossover trend-following strategy is a classic and effective quantitative trading method. By combining multiple moving averages, it can capture medium to long-term trends while filtering out short-term noise to some extent. The core advantages of this strategy lie in its sensitivity to trends and completeness of risk management. However, as a purely technical analysis-driven system, it also faces inherent flaws such as lag and poor performance in ranging markets.
Future optimization directions should focus on improving signal quality, enhancing risk management, and increasing strategy adaptability. By introducing more technical indicators and market factors, a more comprehensive and robust trading system can be constructed. Meanwhile, strategy parameter optimization and adaptive mechanisms are key to performance improvement.
Overall, this strategy provides a solid foundational framework for trend-following trading. Through continuous optimization and improvement, it has the potential to become an efficient and reliable automated trading system. However, investors should still carefully evaluate market conditions when using this strategy and make appropriate adjustments based on individual risk preferences and investment objectives.
//@version=5
strategy("Moving Average Ribbon with Orders", shorttitle="MA Ribbon Orders", overlay=true)

// Hàm tính toán các loại MA
ma(source, length, type) =>
    type == "SMA" ? ta.sma(source, length) :
     type == "EMA" ? ta.ema(source, length) :
     type == "SMMA (RMA)" ? ta.rma(source, length) :
     type == "WMA" ? ta.wma(source, length) :
     type == "VWMA" ? ta.vwma(source, length) :
     na

// MA1
show_ma1   = input(true   , "MA №1", inline="MA #1")
ma1_type   = input.string("SMA"  , ""     , inline="MA #1", options=["SMA", "EMA", "SMMA (RMA)", "WMA", "VWMA"])
ma1_source = input(close  , ""     , inline="MA #1")
ma1_length = input.int(20     , ""     , inline="MA #1", minval=1)
ma1_color  = input(color.new(color.yellow, 0), ""     , inline="MA #1")
ma1 = ma(ma1_source, ma1_length, ma1_type)
plot(show_ma1 ? ma1 : na, color = ma1_color, title="MA №1")

// MA2
show_ma2   = input(true   , "MA №2", inline="MA #2")
ma2_type   = input.string("SMA"  , ""     , inline="MA #2", options=["SMA", "EMA", "SMMA (RMA)", "WMA", "VWMA"])
ma2_source = input(close  , ""     , inline="MA #2")
ma2_length = input.int(50     , ""     , inline="MA #2", minval=1)
ma2_color  = input(color.new(color.orange, 0), ""     , inline="MA #2")
ma2 = ma(ma2_source, ma2_length, ma2_type)
plot(show_ma2 ? ma2 : na, color = ma2_color, title="MA №2")

// MA3
show_ma3   = input(true   , "MA №3", inline="MA #3")
ma3_type   = input.string("SMA"  , ""     , inline="MA #3", options=["SMA", "EMA", "SMMA (RMA)", "WMA", "VWMA"])
ma3_source = input(close  , ""     , inline="MA #3")
ma3_length = input.int(100    , ""     , inline="MA #3", minval=1)
ma3_color  = input(color.new(color.red, 0), ""     , inline="MA #3")
ma3 = ma(ma3_source, ma3_length, ma3_type)
plot(show_ma3 ? ma3 : na, color = ma3_color, title="MA №3")

// MA4
show_ma4   = input(true   , "MA №4", inline="MA #4")
ma4_type   = input.string("SMA"  , ""     , inline="MA #4", options=["SMA", "EMA", "SMMA (RMA)", "WMA", "VWMA"])
ma4_source = input(close  , ""     , inline="MA #4")
ma4_length = input.int(200    , ""     , inline="MA #4", minval=1)
ma4_color  = input(color.new(color.maroon, 0), ""     , inline="MA #4")
ma4 = ma(ma4_source, ma4_length, ma4_type)
plot(show_ma4 ? ma4 : na, color = ma4_color, title="MA №4")

// Điều kiện điểm MUA và BAN
buy_signal = ta.crossover(ma1, ma2) and close > ma4
sell_signal = ta.crossunder(ma1, ma2) and close < ma4

// Vẽ các điểm MUA và BAN
plotshape(series=buy_signal, location=location.belowbar, color=color.green, style=shape.labelup, title="Buy Signal", text="MUA")
plotshape(series=sell_signal, location=location.abovebar, color=color.red, style=shape.labeldown, title="Sell Signal", text="BAN")

// Quản lý trạng thái lệnh
var float entry_price_long = na
var float stop_price_long = na
var float entry_price_short = na
var float stop_price_short = na

if (buy_signal)
    entry_price_long := close
    stop_price_long := low
    strategy.entry("Long", strategy.long)

if (sell_signal)
    entry_price_short := close
    stop_price_short := high
    strategy.entry("Short", strategy.short)

// Điều kiện thoát lệnh
exit_condition_long = ta.crossunder(ma1, ma2) or close < stop_price_long
exit_condition_short = ta.crossover(ma1, ma2) or close > stop_price_short

if (exit_condition_long)
    strategy.exit("Exit Long", "Long", stop=stop_price_long)
    strategy.close("Long")

if (exit_condition_short)
    strategy.exit("Exit Short", "Short", stop=stop_price_short)
    strategy.close("Short")

// Vẽ vùng MUA và BAN
var float buy_price = na
var float sell_price = na

if (buy_signal)
    buy_price := close

if (sell_signal)
    sell_price := close

bgcolor(buy_price and na(sell_price) ? color.new(color.green, 90) : na)
bgcolor(sell_price and na(buy_price) ? color.new(color.red, 90) : na)
- Multi-Moving Average Crossover Trend Following Strategy with Volatility Filter
- Dual Moving Average Momentum Tracking Quantitative Strategy
- Adaptive Moving Average Crossover Strategy
- Bollinger Bands and Moving Average Crossover Strategy
- Bollinger Bands Breakout Momentum Trading Strategy
- Dynamic RSI Quantitative Trading Strategy with Multiple Moving Average Crossover
- Advanced Quantitative Trading Strategy Combining RSI Divergence and Moving Averages
- Multi-Indicator Dynamic Moving Average Crossover Quantitative Strategy
- BB Breakout Strategy
- Dynamic RSI Smart Timing Swing Trading Strategy
- Multi-EMA and Supertrend Crossover Strategy
- Dynamic Mean Reversion and Momentum Strategy
- Dual EMA Dynamic Trend Capture Trading System
- Multi-Confirmation Reversal Buy Strategy
- Enhanced Dual EMA Pullback Breakout Trading Strategy
- Multi-Timeframe Exponential Moving Average Crossover Strategy
- Multi-Period Dynamic Channel Crossover Strategy
- Comprehensive Price Gap Short-Term Trend Capture Strategy
- Multi-Stochastic Oscillation and Momentum Analysis System
- Multi-Timeframe Moving Average and RSI Trend Trading Strategy
- Three-Week High-Low Momentum Trading Strategy
- Adaptive Moving Average Crossover Strategy
- Technical Indicator Strategy, Risk Management Strategy, Adaptive Trend Following Strategy
- Bollinger Bands Momentum Optimization Strategy
- Multi-Level Dynamic Trend Following System
- Advanced Mean Reversion Trading Strategy: Dynamic Range Breakout System Based on Standard Deviation
- EMA Crossover with Bollinger Bands Double Entry Strategy: A Quantitative Trading System Combining Trend Following and Volatility Breakout
- Adaptive Trend-Following Trading Strategy: 200 EMA Breakout with Dynamic Risk Management System
- Multi-Timeframe Market Momentum Crossover Strategy
- Multi-Indicator Trend Following Strategy