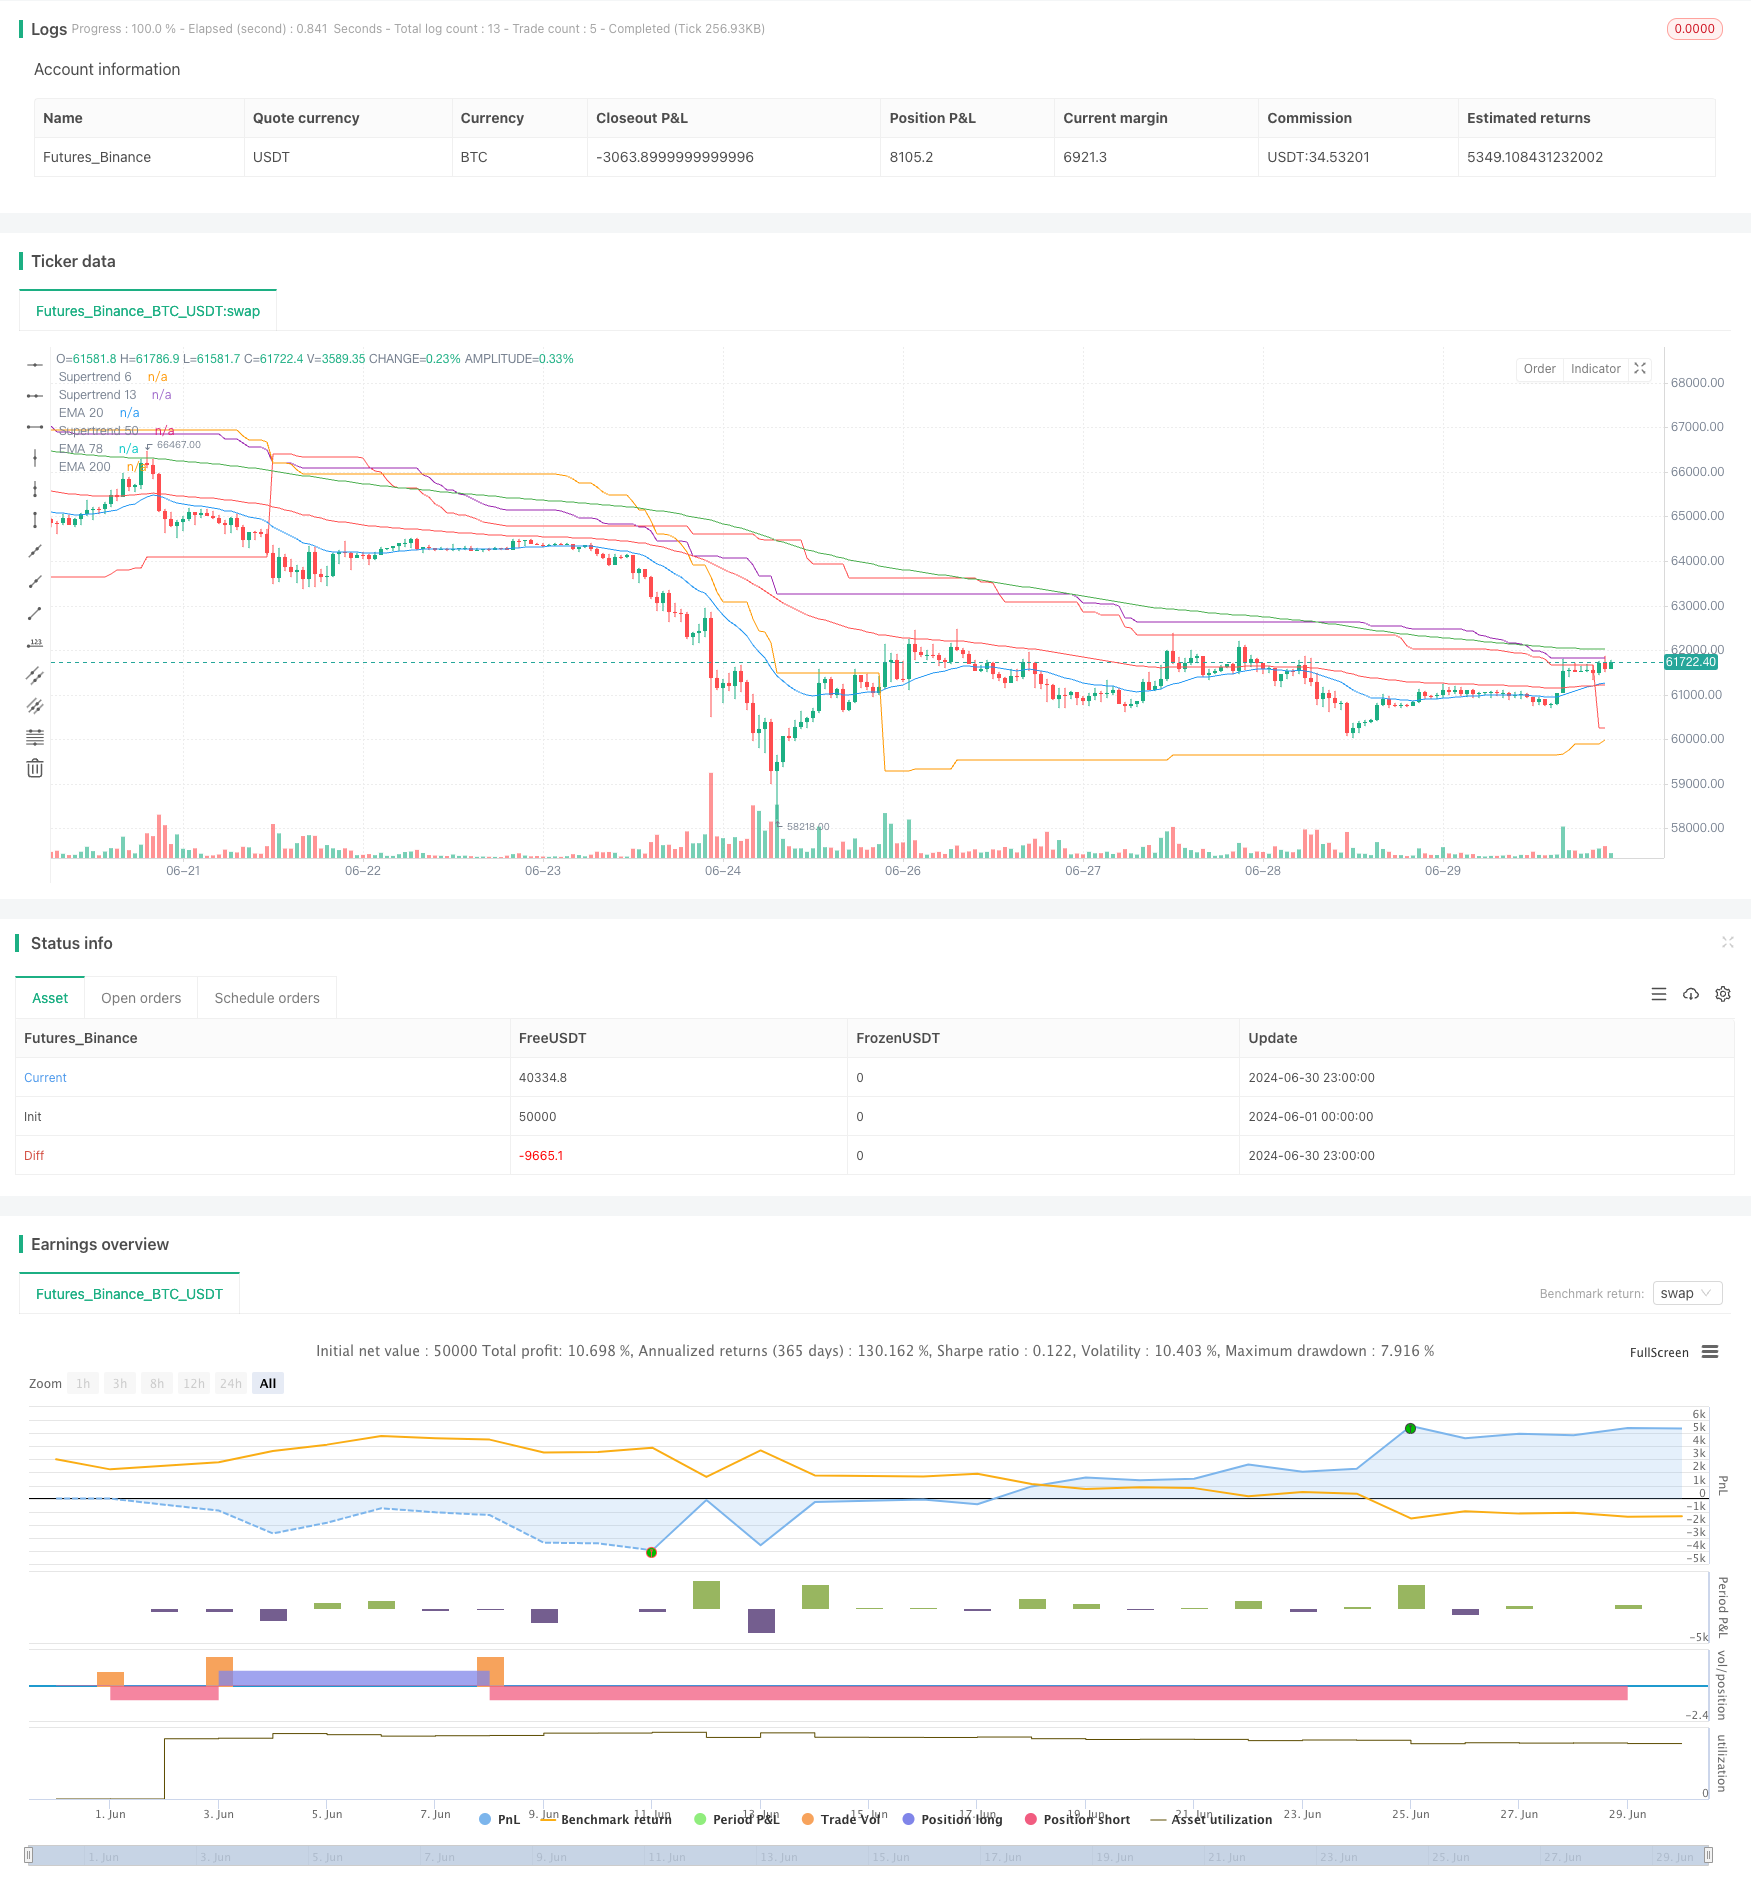
概述
本策略是一个基于多重指数移动平均线(EMA)和Supertrend指标的交易系统。它利用不同周期的EMA和Supertrend指标的交叉来生成买入和卖出信号。该策略旨在捕捉市场趋势的变化,并在趋势确认时进行交易。
策略原理
该策略使用三个不同周期的EMA(22、79和200)和三个不同周期的Supertrend指标(50、13和6)。交易信号的生成基于以下条件:
买入信号:
- 中期EMA(79)低于短期EMA(22)
- 收盘价高于长期EMA(200)
- 收盘价高于所有三个Supertrend指标
卖出信号:
- 中期EMA(79)高于短期EMA(22)
- 收盘价低于长期EMA(200)
- 收盘价低于所有三个Supertrend指标
当满足这些条件时,策略会相应地开仓做多或做空。同时,当出现相反信号时,策略会平掉现有仓位。
策略优势
多重确认:使用多个指标和时间框架可以提供更可靠的交易信号,减少假突破。
趋势跟踪:通过结合EMA和Supertrend,策略能够有效捕捉中长期趋势。
灵活性:可以根据不同市场条件调整EMA和Supertrend的参数。
风险管理:使用长期EMA(200)作为额外的过滤器,有助于避免逆势交易。
自动化:策略可以轻松实现自动化交易,减少人为情绪干扰。
策略风险
滞后性:EMA和Supertrend都是滞后指标,可能导致在趋势反转时入场或出场较晚。
震荡市表现欠佳:在横盘或震荡市场中,策略可能产生频繁的假信号。
过度依赖技术指标:忽视基本面和市场情绪可能导致错误的交易决策。
参数敏感性:策略性能高度依赖于所选择的EMA和Supertrend参数。
缺乏止损机制:代码中没有明确的止损策略,可能导致较大损失。
策略优化方向
引入止损机制:设置基于ATR或固定百分比的止损,以限制单次交易的最大损失。
增加成交量过滤:将成交量指标纳入信号确认过程,以提高信号质量。
优化参数选择:使用历史数据回测不同的EMA和Supertrend参数组合,找出最优设置。
增加趋势强度过滤:引入ADX等趋势强度指标,仅在强趋势中交易。
实现部分仓位管理:允许策略根据信号强度逐步建仓或减仓,而不是全仓操作。
加入市场regime识别:在策略中加入识别当前市场状态(趋势/震荡)的逻辑,并相应调整交易行为。
考虑基本面因素:将重要的经济数据发布或事件作为额外的过滤条件。
总结
多重均线与趋势指标交叉策略是一个结合了多个技术指标的综合交易系统。通过利用不同周期的EMA和Supertrend指标,该策略旨在捕捉强劲的市场趋势并在趋势确认时进行交易。虽然策略具有多重确认和趋势跟踪的优势,但也面临着滞后性和在震荡市表现欠佳等风险。
为了提高策略的稳健性和性能,可以考虑引入止损机制、优化参数选择、增加额外的过滤条件以及实现更灵活的仓位管理。同时,将基本面分析纳入决策过程也可能有助于提高策略的整体效果。
总的来说,这是一个有潜力的策略框架,通过持续优化和调整,有望在各种市场条件下实现稳定的表现。然而,在实盘交易中使用之前,建议进行彻底的回测和前向测试,以确保策略在不同市场环境下的可靠性。
/*backtest
start: 2024-06-01 00:00:00
end: 2024-06-30 23:59:59
period: 1h
basePeriod: 15m
exchanges: [{"eid":"Futures_Binance","currency":"BTC_USDT"}]
*/

//@version=5
strategy("Strategia EMA i Supertrend", overlay=true)

// Definicja parametrów
ema_short_length = 22
ema_medium_length = 79
ema_long_length = 200
supertrend_50_length = 50
supertrend_13_length = 13
supertrend_6_length = 6
supertrend_factor = 6.0  // Ustawienie czynnika na 6 dla wszystkich Supertrend

// Obliczenia EMA
ema_short = ta.ema(close, ema_short_length)
ema_medium = ta.ema(close, ema_medium_length)
ema_long = ta.ema(close, ema_long_length)

// Obliczenia Supertrend
[supertrend_50, _] = ta.supertrend(supertrend_factor, supertrend_50_length)
[supertrend_13, _] = ta.supertrend(supertrend_factor, supertrend_13_length)
[supertrend_6, _] = ta.supertrend(supertrend_factor, supertrend_6_length)

// Warunki sygnału kupna (Long)
buy_signal = (ema_medium < ema_short) and close > ema_long and close > supertrend_50 and close > supertrend_13 and close > supertrend_6

// Warunki sygnału sprzedaży (Short)
sell_signal = (ema_medium > ema_short) and close < ema_long and close < supertrend_50 and close < supertrend_13 and close < supertrend_6

// Rysowanie EMA na wykresie
plot(ema_short, title="EMA 20", color=color.blue)
plot(ema_medium, title="EMA 78", color=color.red)
plot(ema_long, title="EMA 200", color=color.green)

// Rysowanie Supertrend na wykresie
plot(supertrend_50, title="Supertrend 50", color=color.orange)
plot(supertrend_13, title="Supertrend 13", color=color.purple)
plot(supertrend_6, title="Supertrend 6", color=color.red)

// Generowanie sygnałów kupna i sprzedaży
if (buy_signal)
    strategy.entry("Long", strategy.long)

if (sell_signal)
    strategy.entry("Short", strategy.short)

// Zamknięcie pozycji Long przy sygnale sprzedaży
if (sell_signal)
    strategy.close("Long")

// Zamknięcie pozycji Short przy sygnale kupna
if (buy_signal)
    strategy.close("Short")

// Alerty
alertcondition(buy_signal, title="Sygnał Kupna", message="Sygnał Kupna")
alertcondition(sell_signal, title="Sygnał Sprzedaży", message="Sygnał Sprzedaży")