Multi-EMA Crossover Trend Following Quantitative Trading Strategy
Author: ChaoZhang, Date: 2025-01-10 16:33:35Tags: EMAMA

Overview
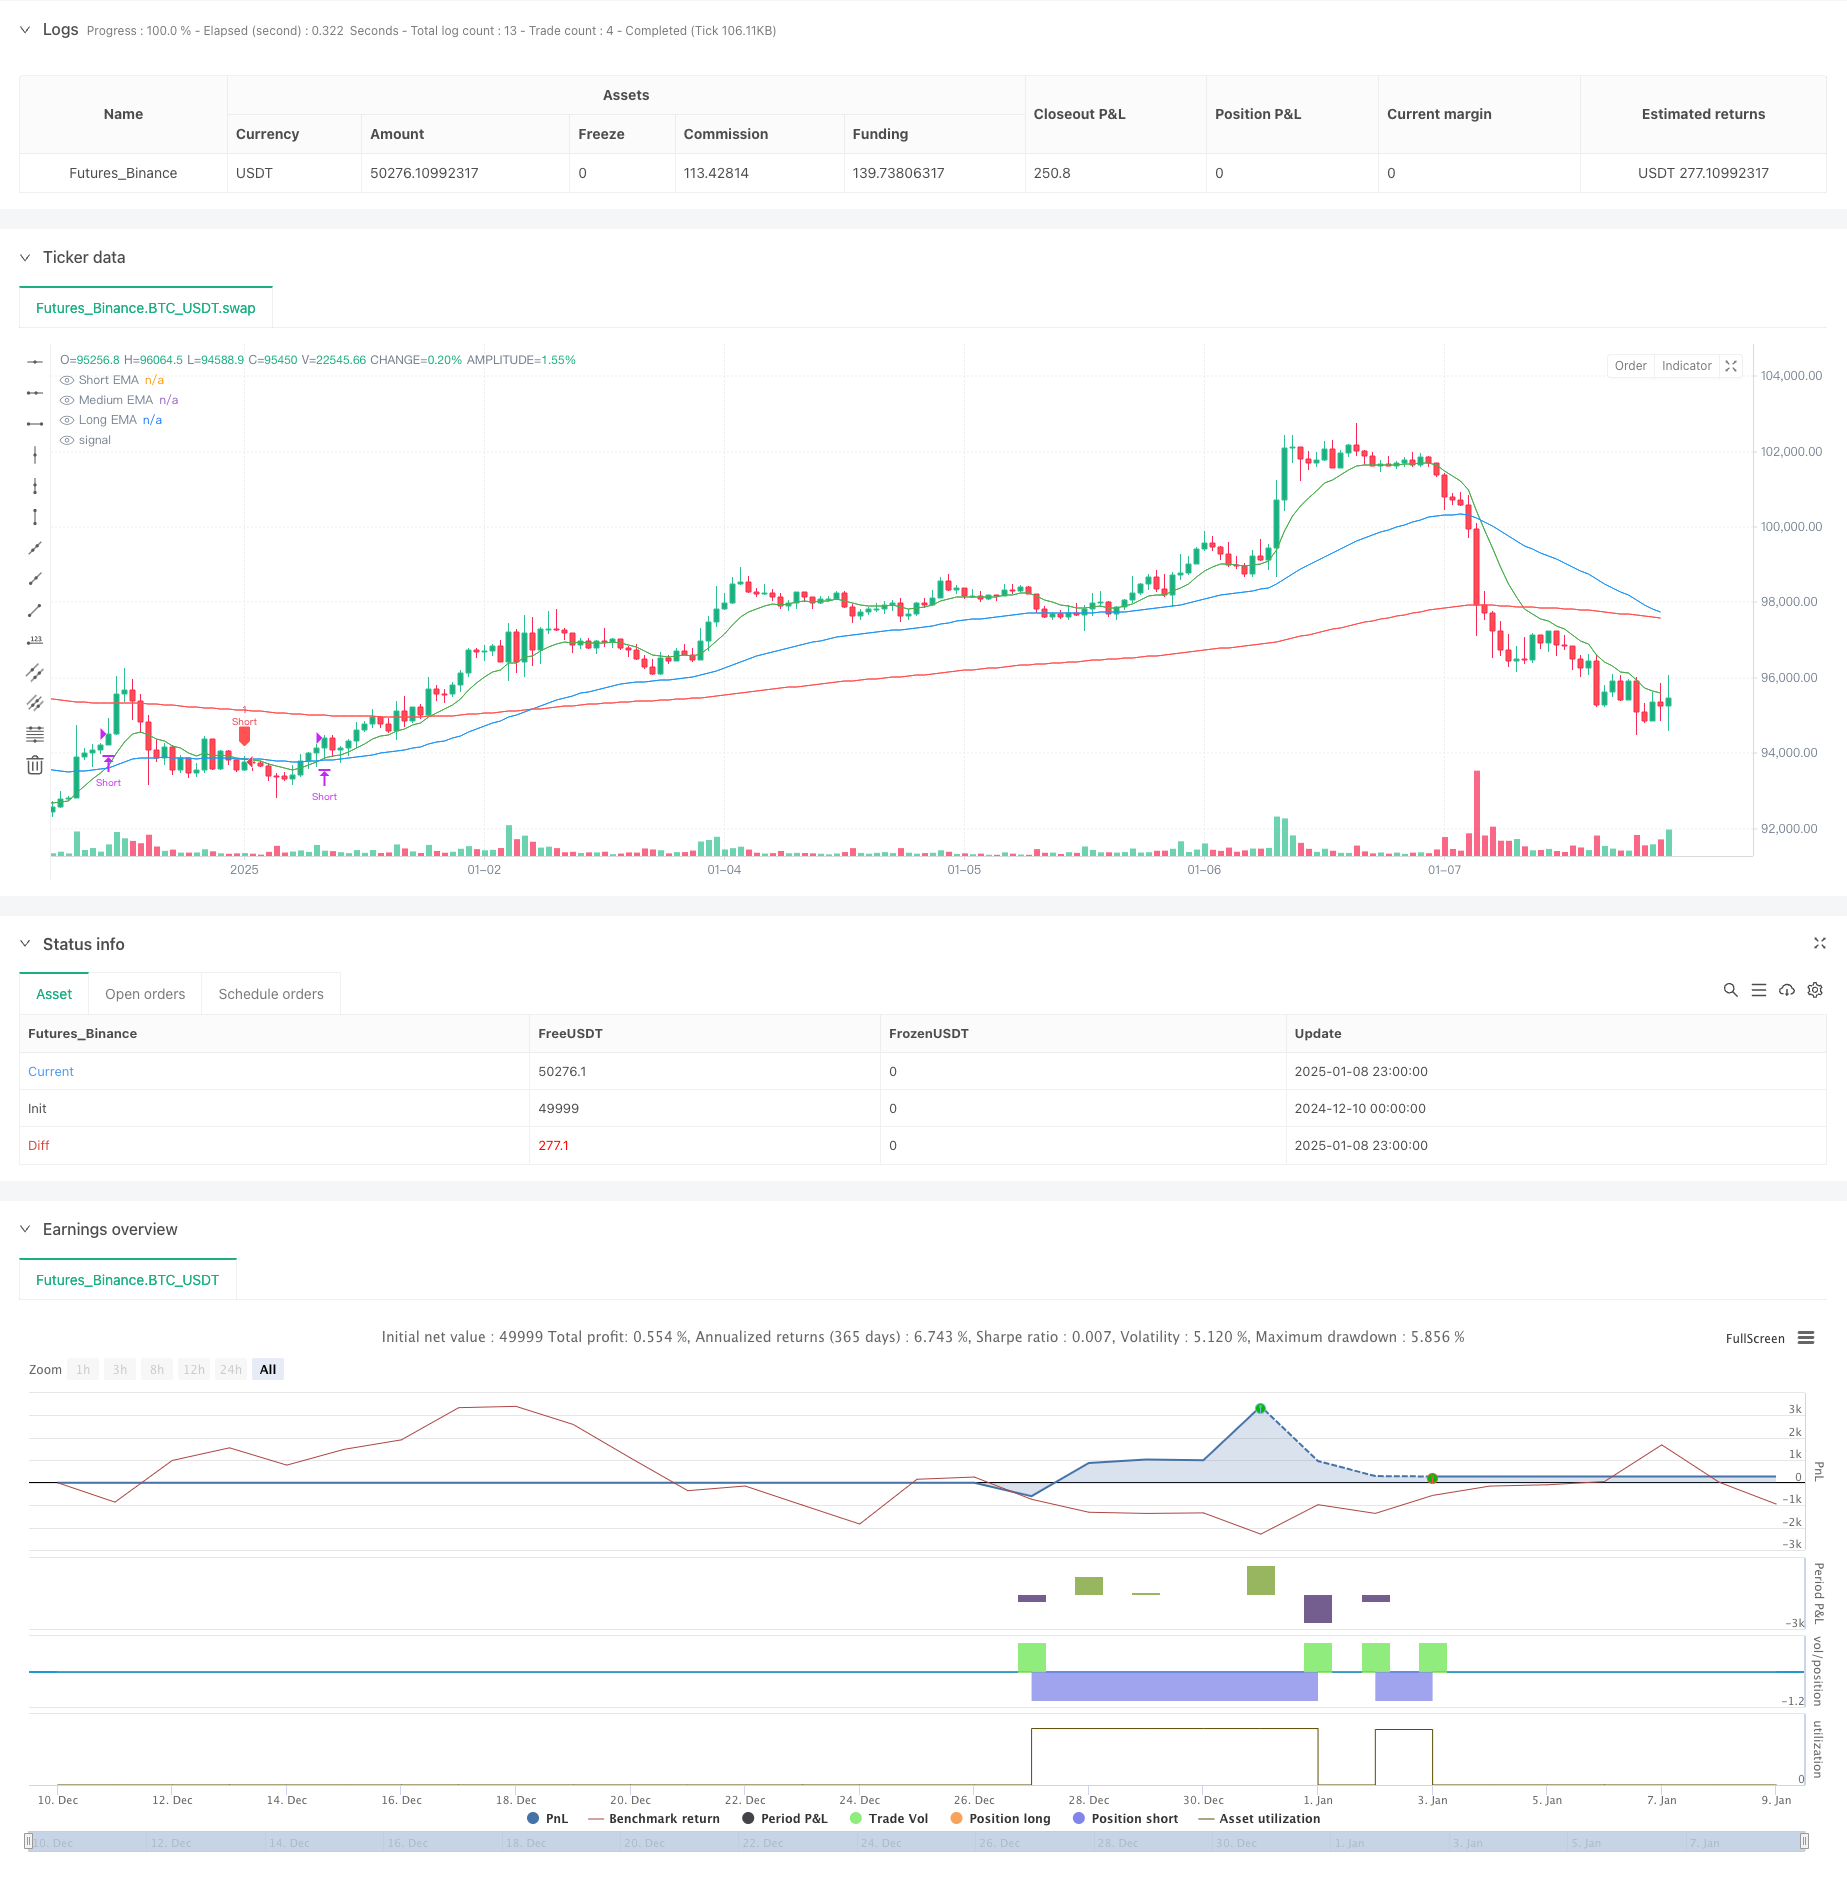
This is a trend following strategy based on multiple Exponential Moving Average (EMA) crossovers. The strategy utilizes the crossover relationships between a 10-period short-term EMA, 50-period medium-term EMA, and 200-period long-term EMA to capture market trends and execute long/short trades when conditions are met. The core idea is to filter market noise through multiple timeframe moving averages, identify the main trend direction, and capture profits during trend continuation.
Strategy Principles
The strategy employs a triple EMA crossover system as its signal generation mechanism. Specifically: 1. Uses 200-period EMA as the main trend indicator, only taking long positions above it and short positions below it 2. Opens long positions when short-term EMA (10-period) crosses above medium-term EMA (50-period) and price is above long-term EMA 3. Opens short positions when short-term EMA crosses below medium-term EMA and price is below long-term EMA 4. Closes long positions when short-term EMA crosses below medium-term EMA 5. Closes short positions when short-term EMA crosses above medium-term EMA The strategy includes debugging features to monitor abnormal EMA crossovers and relationships.
Strategy Advantages
- Multiple timeframe filtering: Effectively reduces false signals by combining EMAs of different periods
- Strong trend following capability: Strategy design aligns with trend following logic, capturing major trends well
- Robust risk control: Uses EMA crossovers as stop-loss signals to control risk
- Simple and clear logic: Strategy rules are clear, easy to understand and execute
- High adaptability: Applicable to different markets and timeframes
- High automation potential: Clear strategy rules facilitate programming implementation
Strategy Risks
- Choppy market risk: May result in frequent trades and losses during sideways markets
- Lag risk: Moving averages have inherent lag, potentially missing trend reversal points
- False breakout risk: Short-term price fluctuations may trigger false signals
- Money management risk: Fixed position sizing may be too risky in certain market conditions
- Parameter optimization risk: Over-optimization may lead to strategy overfitting
Strategy Optimization Directions
- Introduce volatility indicators: Consider adding ATR or similar indicators for dynamic position sizing
- Add trend strength filtering: Consider incorporating ADX or similar indicators to measure trend strength
- Optimize stop-loss mechanism: Consider implementing trailing stops or fixed stops
- Enhance market state detection: Add logic to distinguish between trending and ranging markets
- Improve position management: Dynamically adjust position sizes based on market volatility
Summary
This strategy is a classic trend following system that ensures major trend capture while maintaining timely profit-taking and stop-loss through the use of multiple EMAs. Though it has some inherent lag, reasonable parameter settings and risk management can still generate stable returns in trending markets. The strategy has significant optimization potential through the introduction of additional technical indicators and refined trading rules.
/*backtest
start: 2024-12-10 00:00:00
end: 2025-01-09 00:00:00
period: 1h
basePeriod: 1h
exchanges: [{"eid":"Futures_Binance","currency":"BTC_USDT","balance":49999}]
*/

//@version=5
strategy("EMA Crossover Strategy (Enhanced Debug)", overlay=true)

// Inputs for EMA periods
shortEMA = input.int(10, title="Short EMA Period")
mediumEMA = input.int(50, title="Medium EMA Period")
longEMA = input.int(200, title="Long EMA Period")

// Calculating EMAs
emaShort = ta.ema(close, shortEMA)
emaMedium = ta.ema(close, mediumEMA)
emaLong = ta.ema(close, longEMA)

// Plot EMAs
plot(emaShort, color=color.green, title="Short EMA")
plot(emaMedium, color=color.blue, title="Medium EMA")
plot(emaLong, color=color.red, title="Long EMA")

// Conditions for entry and exit
longCondition = close > emaLong and ta.crossover(emaShort, emaMedium) and emaMedium > emaLong
shortCondition = close < emaLong and ta.crossunder(emaShort, emaMedium) and emaMedium < emaLong
closeLongCondition = ta.crossunder(emaShort, emaMedium)
closeShortCondition = ta.crossover(emaShort, emaMedium)

// Debugging labels for unexpected behavior
if (ta.crossover(emaShort, emaLong) and not ta.crossover(emaShort, emaMedium))
    label.new(bar_index, high, "Short > Long", style=label.style_circle, color=color.red, textcolor=color.white)

// Debugging EMA relationships
if (emaMedium <= emaLong)
    label.new(bar_index, high, "Medium < Long", style=label.style_cross, color=color.orange, textcolor=color.white)

// Entry logic
if (longCondition)
    strategy.entry("Long", strategy.long)

if (shortCondition)
    strategy.entry("Short", strategy.short)

// Exit logic
if (closeLongCondition)
    strategy.close("Long")

if (closeShortCondition)
    strategy.close("Short")

// Display labels for signals
plotshape(series=longCondition, style=shape.labelup, color=color.green, location=location.belowbar, title="Buy Signal")
plotshape(series=shortCondition, style=shape.labeldown, color=color.red, location=location.abovebar, title="Sell Signal")
- Cross-Market Overnight Position Strategy with EMA Filter
- EMA Dual Moving Average Crossover Strategy
- EMA Momentum Trading Strategy
- Triple EMA Crossover Trading Strategy with Dynamic Stop-Loss and Take-Profit
- Multi-EMA Crossover Momentum Trend Following Strategy
- Multi-EMA Automated Trading System with Trailing Profit Lock
- MACD Crossover Strategy
- Triple EMA Trend Following Quantitative Trading Strategy
- Multi-Timeframe EMA Trend Strategy with Daily High-Low Breakout System
- Dual Chain Hybrid Momentum EMA Tracking Trading System
- Multi-level Indicator Overlapping RSI Trading Strategy
- Bollinger Bands and Fibonacci Intraday Trend Following Strategy
- Dynamic Trend Following Dual Moving Average Channel Strategy with Risk Management System
- Multi-Mode Take Profit/Stop Loss Trend Following Strategy Based on EMA, Madrid Ribbon and Donchian Channel
- Multi-Indicator Trend Momentum Trading Strategy: An Optimized Quantitative Trading System Based on Bollinger Bands, Fibonacci and ATR
- Dynamic RSI-Price Divergence Detection and Adaptive Trading Strategy System
- Multi-Dimensional Trend Following Pyramid Trading Strategy
- Triple Bottom Rebound Momentum Breakthrough Strategy
- Dual Timeframe Trend Reversal Candlestick Pattern Quantitative Trading Strategy
- High-Frequency Price-Volume Trend Following with Volume Analysis Adaptive Strategy