概述
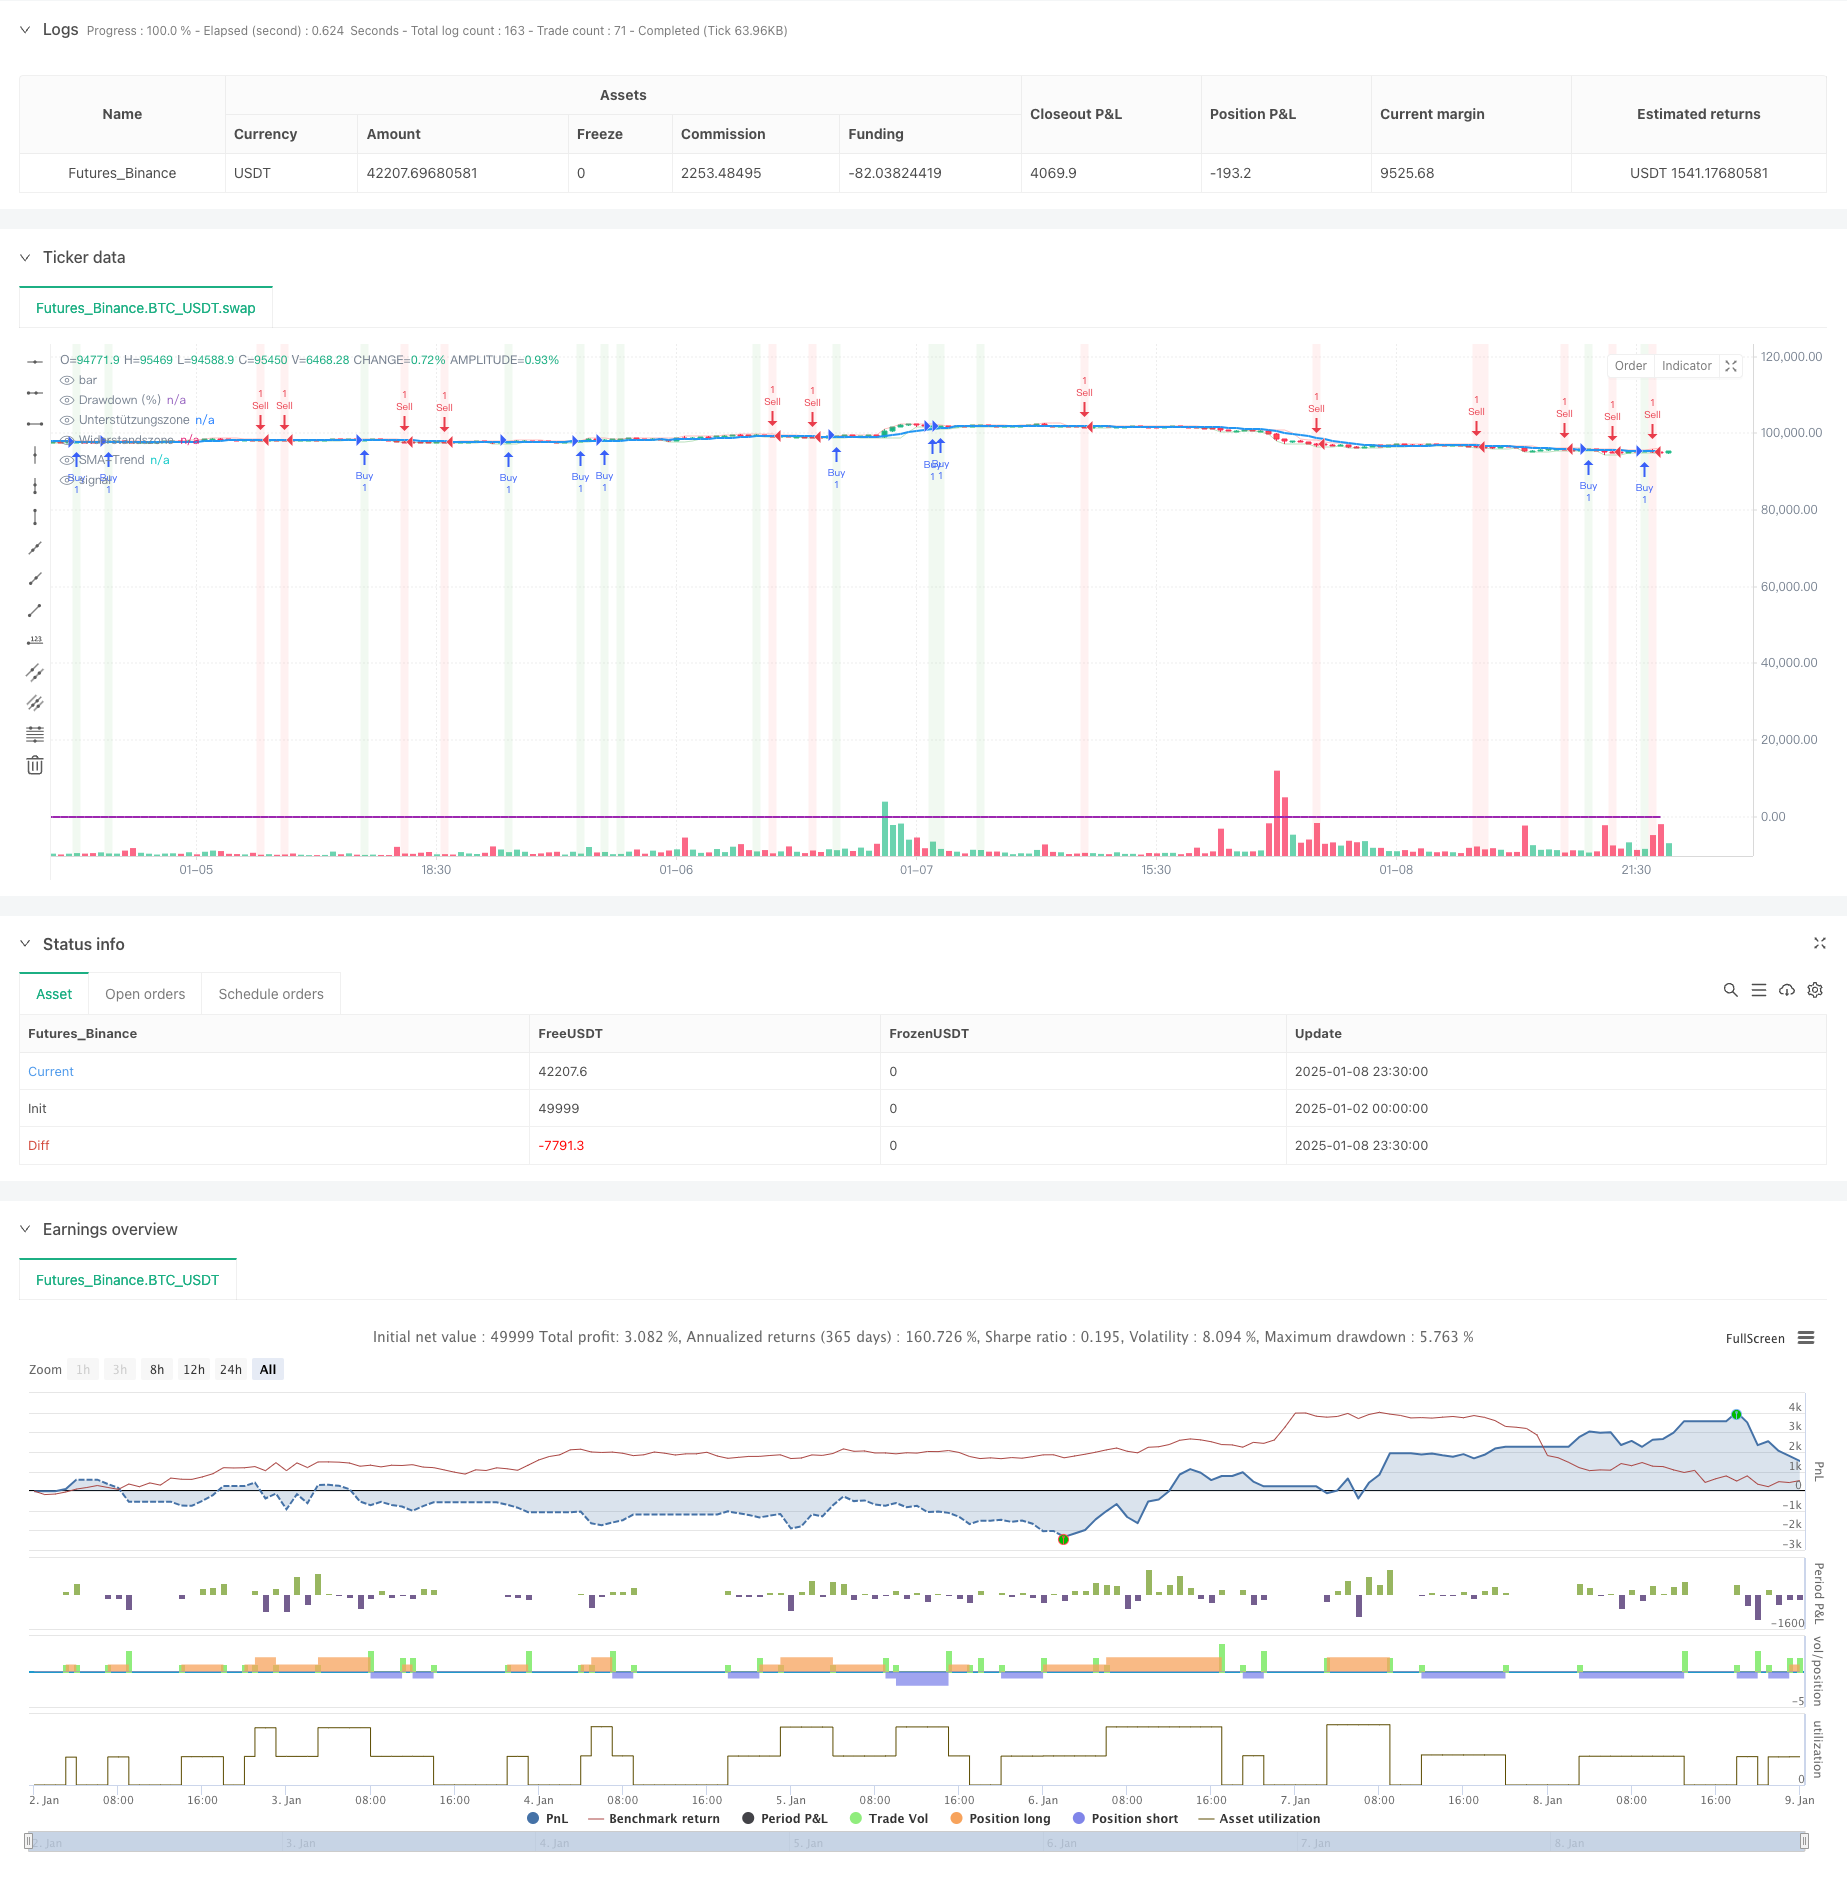
这是一个基于德国金融机构广泛使用的Markttechnik(MT)分析方法的量化交易策略。该策略结合了移动平均线(SMA)趋势跟踪、支撑阻力位识别、反转K线形态分析以及金字塔式加仓等多个维度,通过严格的风险控制来实现稳健的交易。策略的核心在于通过多维度信号的综合判断来确定市场趋势方向,并在趋势形成时通过金字塔式加仓来扩大盈利。
策略原理
策略采用以下几个关键组件来构建交易系统: 1. 趋势判断:使用10周期简单移动平均线(SMA)作为主要趋势判断指标,价格在SMA之上视为上升趋势,反之为下降趋势。 2. 支撑阻力:通过3个周期的最高价和最低价来确定短期支撑阻力区域。 3. 反转形态:分析锤子线和流星线这两种重要的反转K线形态。 4. 交易信号:在确认趋势方向的基础上,结合支撑阻力位和反转K线形态来触发交易信号。 5. 仓位管理:采用金字塔式加仓策略,最多允许2倍的仓位累加。 6. 风险控制:设置5%的最大回撤限制,并使用2.0的风险收益比来设置止损止盈。
策略优势
- 多维度信号确认:通过趋势、支撑阻力、K线形态等多个维度的信号综合分析,提高交易的准确性。
- 金字塔式加仓:在趋势延续时可以通过加仓来扩大盈利空间。
- 严格的风险控制:通过最大回撤限制和固定的风险收益比来控制风险。
- 可视化支持:策略提供了完整的图形化展示,包括支撑阻力区域、趋势线和信号背景等。
- 灵活的参数设置:关键参数都可以根据不同市场情况进行调整。
策略风险
- 趋势反转风险:在强趋势突然反转时可能造成连续损失。
- 假突破风险:市场可能出现虚假的支撑阻力突破信号。
- 参数敏感性:策略表现对参数设置较为敏感,不同市场环境可能需要不同的参数组合。
- 滑点影响:在市场波动较大时,实际成交价格可能与信号价格有较大偏差。
- 加仓风险:金字塔式加仓在市场剧烈波动时可能放大损失。
策略优化方向
- 动态参数优化:可以引入自适应参数调整机制,根据市场波动情况动态调整各项参数。
- 市场环境分类:增加市场环境识别模块,在不同市场环境下采用不同的参数组合。
- 止损优化:可以引入移动止损机制,更好地保护已有盈利。
- 加仓条件细化:可以根据波动率、成交量等因素来优化加仓条件。
- 信号过滤:增加成交量、波动率等过滤条件,提高信号质量。
总结
该策略通过多维度信号分析和严格的风险控制,构建了一个完整的交易系统。策略的核心优势在于信号的可靠性和风险的可控性,但仍需要针对不同市场环境进行参数优化。通过建议的优化方向,策略的稳定性和盈利能力有望得到进一步提升。策略适合在趋势明显的市场中运用,对于寻求稳健收益的交易者来说是一个值得考虑的选择。
策略源码
/*backtest
start: 2025-01-02 00:00:00
end: 2025-01-09 00:00:00
period: 30m
basePeriod: 30m
exchanges: [{"eid":"Futures_Binance","currency":"BTC_USDT","balance":49999}]
*/

//@version=6
strategy("Markttechnik Strategie mit Pyramiding und Drawdown-Limit", overlay=true, pyramiding=2)

// Eingabewerte
lengthSupport = input.int(3, title="Unterstützungs-/Widerstandsfenster", minval=1)
lengthSMA = input.int(10, title="SMA Länge für Trends", minval=1)
riskRewardRatio = input.float(2.0, title="Risk-Reward-Ratio", minval=0.1, step=0.1)
maxDrawdown = input.float(5.0, title="Maximaler Drawdown (%)", minval=0.1, step=0.1)

// Unterstützungs- und Widerstandszonen berechnen
support = ta.lowest(low, lengthSupport)
resistance = ta.highest(high, lengthSupport)

// Trendindikator (SMA-basierter Trend)
sma = ta.sma(close, lengthSMA)
trendUp = close > sma
trendDown = close < sma

// Umkehrstäbe erkennen
isHammer = close > open and (low < open) and ((open - low) > 2 * (close - open))
isShootingStar = open > close and (high > open) and ((high - open) > 2 * (open - close))

// Kauf- und Verkaufssignale
buySignal = isHammer and close > support and trendUp
sellSignal = isShootingStar and close < resistance and trendDown

// Strategiefunktionen: Pyramiding und Drawdown
equityPeak = na(strategy.equity[1]) or strategy.equity > strategy.equity[1] ? strategy.equity : strategy.equity[1]  // Höchster Kontostand
drawdown = equityPeak > 0 ? (strategy.equity - equityPeak) / equityPeak * 100 : 0  // Drawdown in Prozent

if buySignal and drawdown > -maxDrawdown
    strategy.entry("Buy", strategy.long)
    strategy.exit("Sell", "Buy", stop=low - (high - low) * riskRewardRatio, limit=close + (close - low) * riskRewardRatio)

if sellSignal and drawdown > -maxDrawdown
    strategy.entry("Sell", strategy.short)
    strategy.exit("Cover", "Sell", stop=high + (high - low) * riskRewardRatio, limit=close - (high - close) * riskRewardRatio)

// Unterstützungs- und Widerstandslinien zeichnen
plot(support, color=color.new(color.green, 80), linewidth=1, title="Unterstützungszone")
plot(resistance, color=color.new(color.red, 80), linewidth=1, title="Widerstandszone")

// Trendlinie (SMA)
plot(sma, color=color.blue, linewidth=2, title="SMA-Trend")

// Umkehrstäbe hervorheben
bgcolor(buySignal ? color.new(color.green, 90) : na, title="Kaufsignal Hintergrund")
bgcolor(sellSignal ? color.new(color.red, 90) : na, title="Verkaufssignal Hintergrund")

// Debugging: Drawdown anzeigen
plot(drawdown, title="Drawdown (%)", color=color.purple, linewidth=2, style=plot.style_line)
相关推荐