El MTF RSI y la Estrategia STOCH
El autor:¿ Qué pasa?, Fecha: 2022-05-10 10:41:43Las etiquetas:La SMA
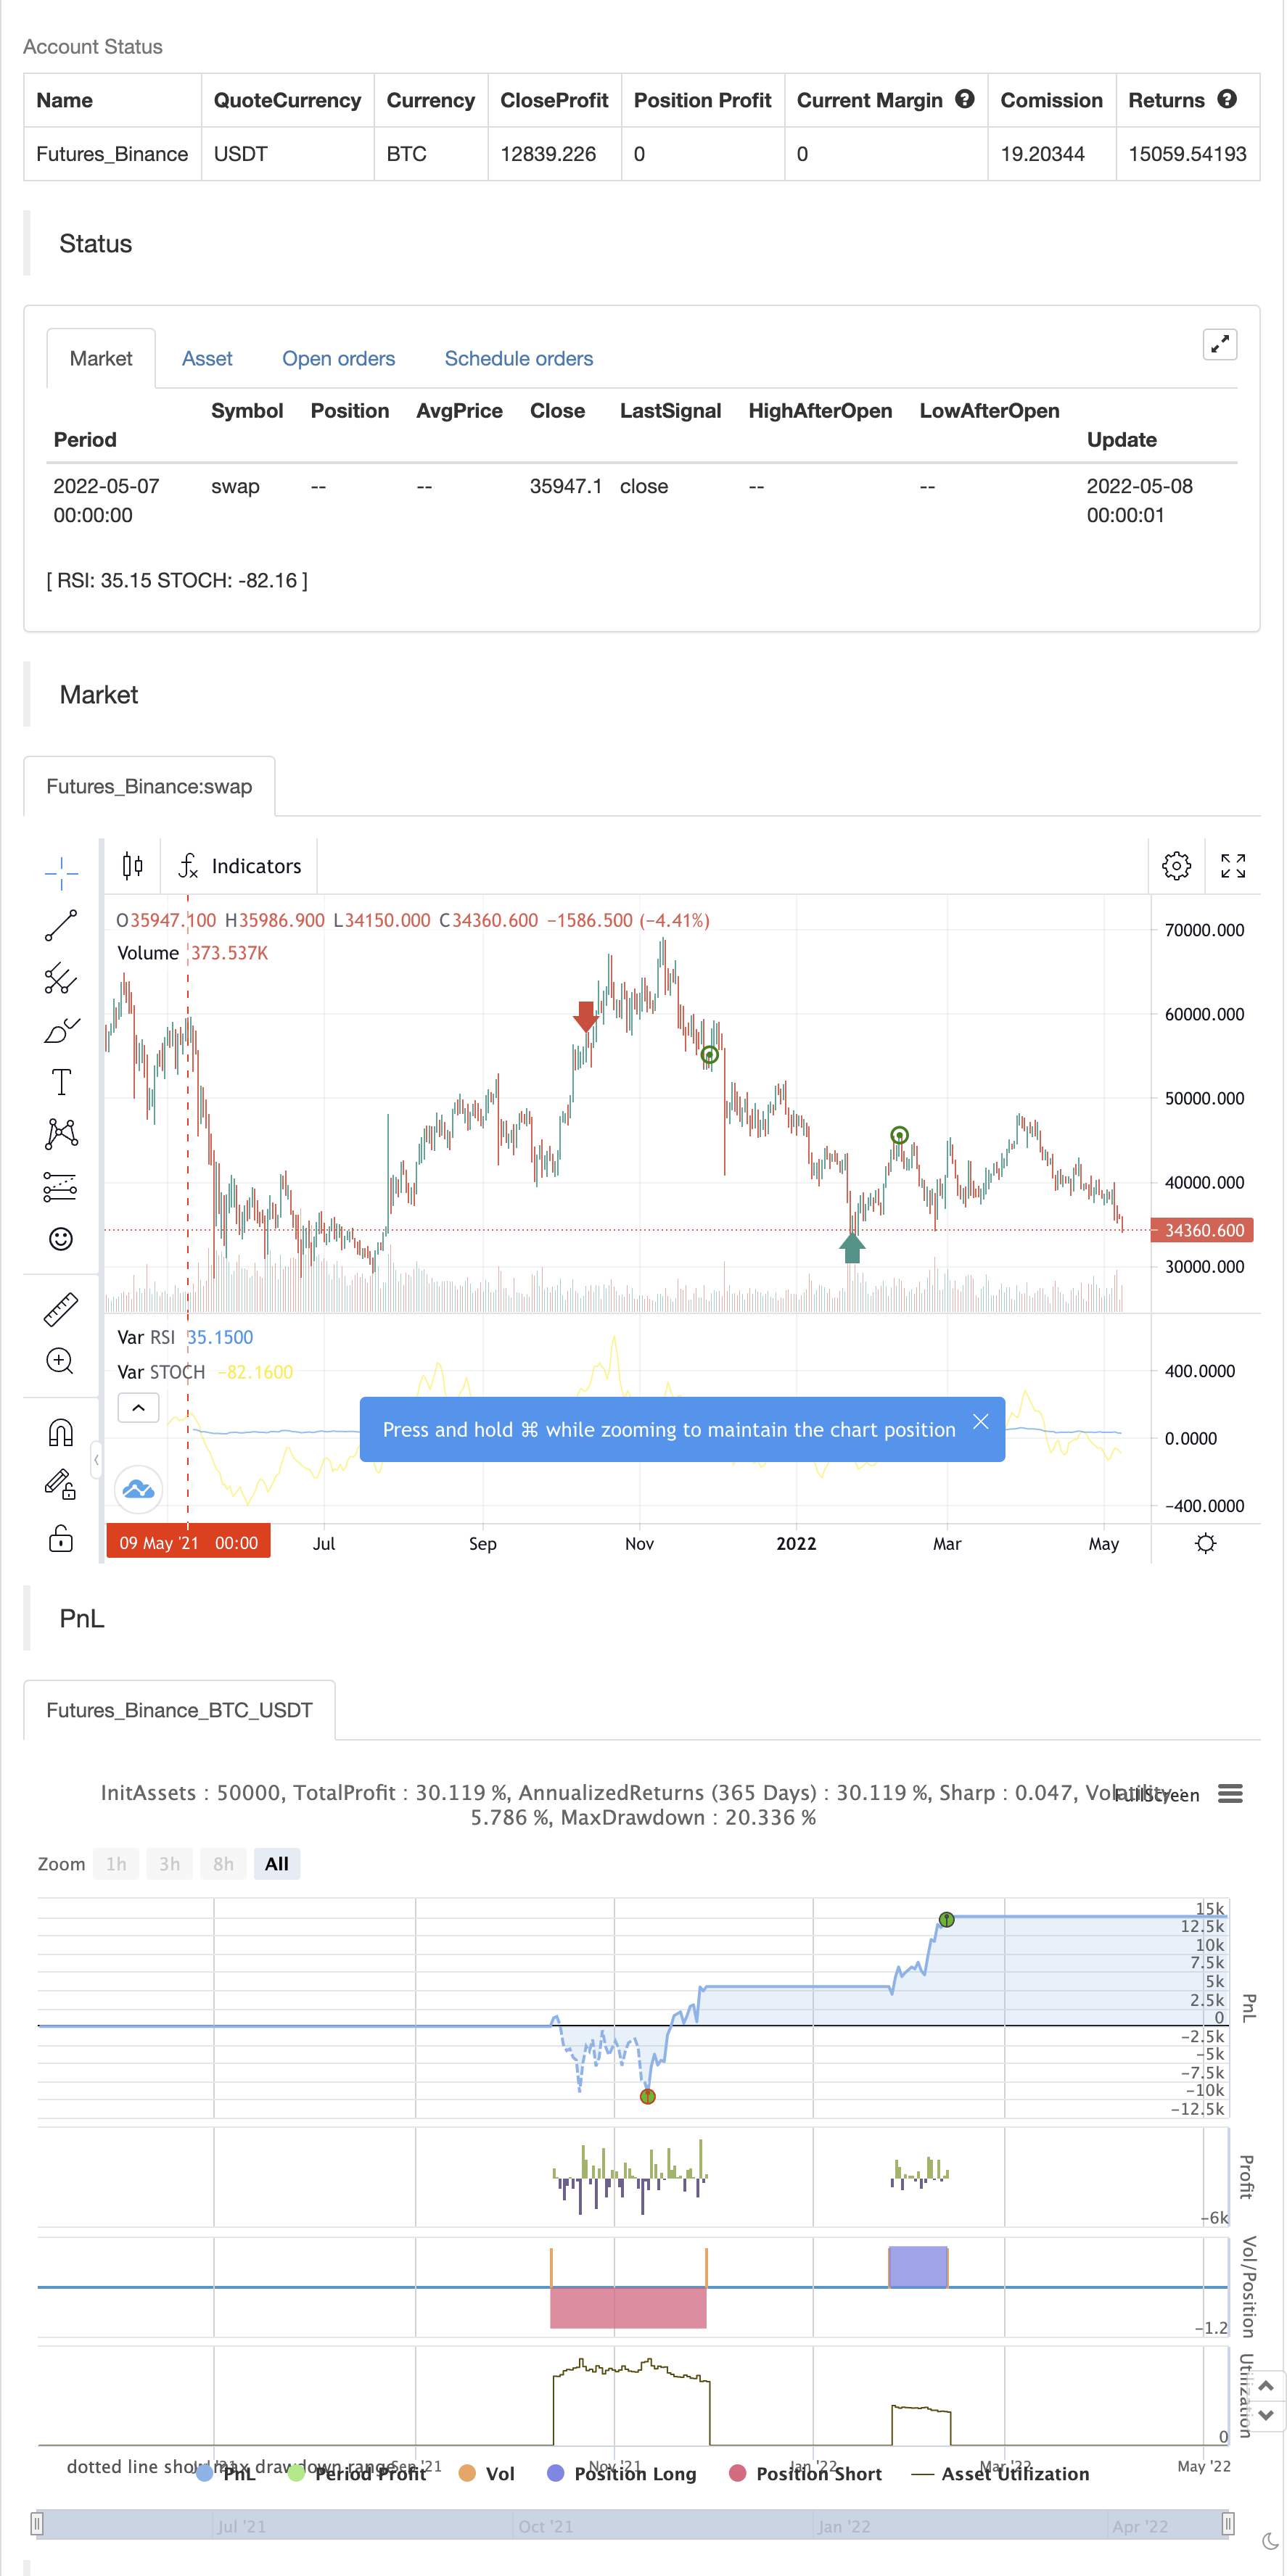
Este intercambio es un indicador donde se puede ver el promedio de diferentes marcos de tiempo.
El RSI es la línea azul La acción es la línea amarilla
Puedes gestionar el tiempo en los parámetros.
La estrategia es tomar una posición cuando las dos líneas se sobrecompran o sobrevenden y cerrar cuando la bolsa y el RSI se mueven hacia el medio.
Prueba posterior

/*backtest
start: 2021-05-09 00:00:00
end: 2022-05-08 23:59:00
period: 1d
basePeriod: 1h
exchanges: [{"eid":"Futures_Binance","currency":"BTC_USDT"}]
*/

////////////////////////////////////////// MTF Stochastic & RSI Strategy ©️ bykzis /////////////////////////////////////////
//

// *** Inspired by "Binance CHOP Dashboard" from @Cazimiro and "RSI MTF Table" from @mobester16 *** and LOT OF COPY of Indicator-Jones MTF Scanner
//
////////////////////////////////////////////////////////////////////////////////////////////////////////////////////////////

//@version=5
//strategy('MTF RSI & STOCH Strategy', overlay=false,initial_capital=100, currency=currency.USD, commission_value=0.01, commission_type=strategy.commission.percent)


// Pair list
var string GRP1       = '══════════    General    ══════════'
overbought = input.int(80, 'Overbought Level', minval=1, group=GRP1)
oversold = input.int(20, 'Oversold Level', minval=1, group=GRP1)


/// Timeframes
var string GRP2       = '══════════   Timeframes   ══════════'
timeframe1 = input.timeframe(title="Timeframe 1", defval="W", group=GRP2)
timeframe2 = input.timeframe(title="Timeframe 2", defval="D", group=GRP2)
timeframe3 = input.timeframe(title="Timeframe 3", defval="240", group=GRP2)
timeframe4 = input.timeframe(title="Timeframe 4", defval="60", group=GRP2)

// RSI settings
var string GRP3       = '══════════   RSI settings   ══════════'
rsiLength = input.int(14, minval=1, title='RSI length', group=GRP3)
rsiSource = input(close, 'RSI Source', group=GRP3)
rsioverbought = input.int(70, 'RSI Overbought Level', minval=1, group=GRP3)
rsioversold = input.int(30, 'RSI Oversold Level', minval=1, group=GRP3)


/// Get RSI values of each timeframe /////////////////////////////////////////////////////
rsi = ta.rsi(rsiSource, rsiLength)
callRSI(id,timeframe) =>
    rsiValue = request.security(id, str.tostring(timeframe), rsi, gaps=barmerge.gaps_off)
    rsiValue

RSI_TF1 = callRSI(syminfo.tickerid, timeframe1)
RSI_TF2 = callRSI(syminfo.tickerid, timeframe2)
RSI_TF3 = callRSI(syminfo.tickerid, timeframe3)
RSI_TF4 = callRSI(syminfo.tickerid, timeframe4)


/////// Calculate Averages /////////////////////////////////////////////////////////////////
calcAVG(valueTF1, valueTF2, valueTF3, valueTF4) =>
    math.round((valueTF1 + valueTF2 + valueTF3 + valueTF4) / 4, 2)

AVG=calcAVG(RSI_TF1, RSI_TF2, RSI_TF3, RSI_TF4)


// Stochastic settings
var string GRP4       = '══════════   Stochastic settings   ══════════'
periodK = input.int(14, '%K length', minval=1, group=GRP4)
smoothK = input.int(3, 'Smooth K', minval=1, group=GRP4)
stochSource = input(close, 'Stochastic Source', group=GRP4)
stochoverbought = input.int(70, 'Stochastic Overbought Level', minval=1, group=GRP4)
stochoversold = input.int(30, 'Stochastic Oversold Level', minval=1, group=GRP4)


/// Get Stochastic values of each timeframe ////////////////////////////////////////////////
stoch = ta.sma(ta.stoch(stochSource, high, low, periodK), smoothK)
getStochastic(id,timeframe) =>
    stochValue = request.security(id, str.tostring(timeframe), stoch, gaps=barmerge.gaps_off)
    stochValue

Stoch_TF1 = getStochastic(syminfo.tickerid, timeframe1)
Stoch_TF2 = getStochastic(syminfo.tickerid, timeframe2)
Stoch_TF3 = getStochastic(syminfo.tickerid, timeframe3)
Stoch_TF4 = getStochastic(syminfo.tickerid, timeframe4)


AVG_STOCH=calcAVG(Stoch_TF1, Stoch_TF2, Stoch_TF3, Stoch_TF4)


plot(AVG, color = color.blue, title='RSI')
plot(AVG_STOCH, color = color.yellow,title='STOCH')
hline(rsioverbought,color=color.red)
hline(rsioversold, color=color.lime)
hline(50, color=color.white)

//============ signal Generator ==================================//

if AVG <= rsioversold and AVG_STOCH <=stochoversold
    strategy.entry('Buy_Long', strategy.long)


strategy.close("Buy_Long",when=(AVG_STOCH >=70 and AVG >=50 and close >=strategy.position_avg_price),comment="Long_OK")

if AVG >=rsioverbought and AVG_STOCH >=stochoverbought
    strategy.entry('Buy_Short', strategy.short)


strategy.close("Buy_Short",when=(AVG_STOCH <=30 and AVG <=50 and close <=strategy.position_avg_price),comment="Short_OK")


///////////////////////////////////////////////////////////////////////////////////////////
Contenido relacionado
- El juicio de tendencias multidimensionales y la estrategia de stop loss dinámico de ATR
- Estrategias de transacción cuantitativa para adaptarse a la tendencia de inversión de la franja de Bryn
- Las tendencias de alto nivel de múltiples indicadores confirman la estrategia de negociación
- Estrategias de negociación de tendencias de múltiples señales de doble línea-RSI
- Estrategias de seguimiento de tendencias de adaptación y confirmación múltiple
- Dinámica de ajuste de pérdidas para el seguimiento de la tendencia de la columna del elefante
- Estrategias de negociación cuantificadas de parámetros dinámicos de RSI con ayuda de líneas multicruzadas
- Algoritmos de proximidad K multidimensionales y estrategias de negociación de análisis de precios cuantitativos en forma de deslizamiento
- Estrategias inteligentes de seguimiento de pérdidas basadas en las medias móviles y los patrones diarios
- Sistema de cambio dinámico multiestratégico adaptable: estrategias de negociación cuantitativas para el seguimiento de tendencias de convergencia y la oscilación de la franja
- Tendencias multidimensionales de múltiples indicadores y estrategias avanzadas de cuantificación
Más contenido
- Fractales más pequeños (+ Transparencia)
- Puntos de entrada BB-RSI-ADX
- En el casco-4ema
- Indicador de línea de seguimiento de ángulo de ataque
- Línea KijunSen con cruz
- AMACD - Divergencia de la convergencia de la media móvil
- MA HYBRID por RAJ
- Tendencia de los diamantes
- Nik Stoch fue el primero.
- el valor de las emisiones de gases de efecto invernadero es el valor de las emisiones
- EMA + AROON + ASH
- Impulso 2.0
- Estrategia de la gama de EHMA
- Promedio móvil de compra-venta
- Midas Mk. II - El último Crypto Swing
- TMA-herencia
- La estrategia de los altos y bajos de tv
- Mejor estrategia de tradingView
- Alertas R3.0 + Condición de volatilidad de aumento + TP RSI
- No puedo.