Estrategia de doble brecha entre Bitcoin y oro
El autor:¿ Qué pasa?, Fecha: 2024-01-23 15:28:56Las etiquetas:

Resumen general
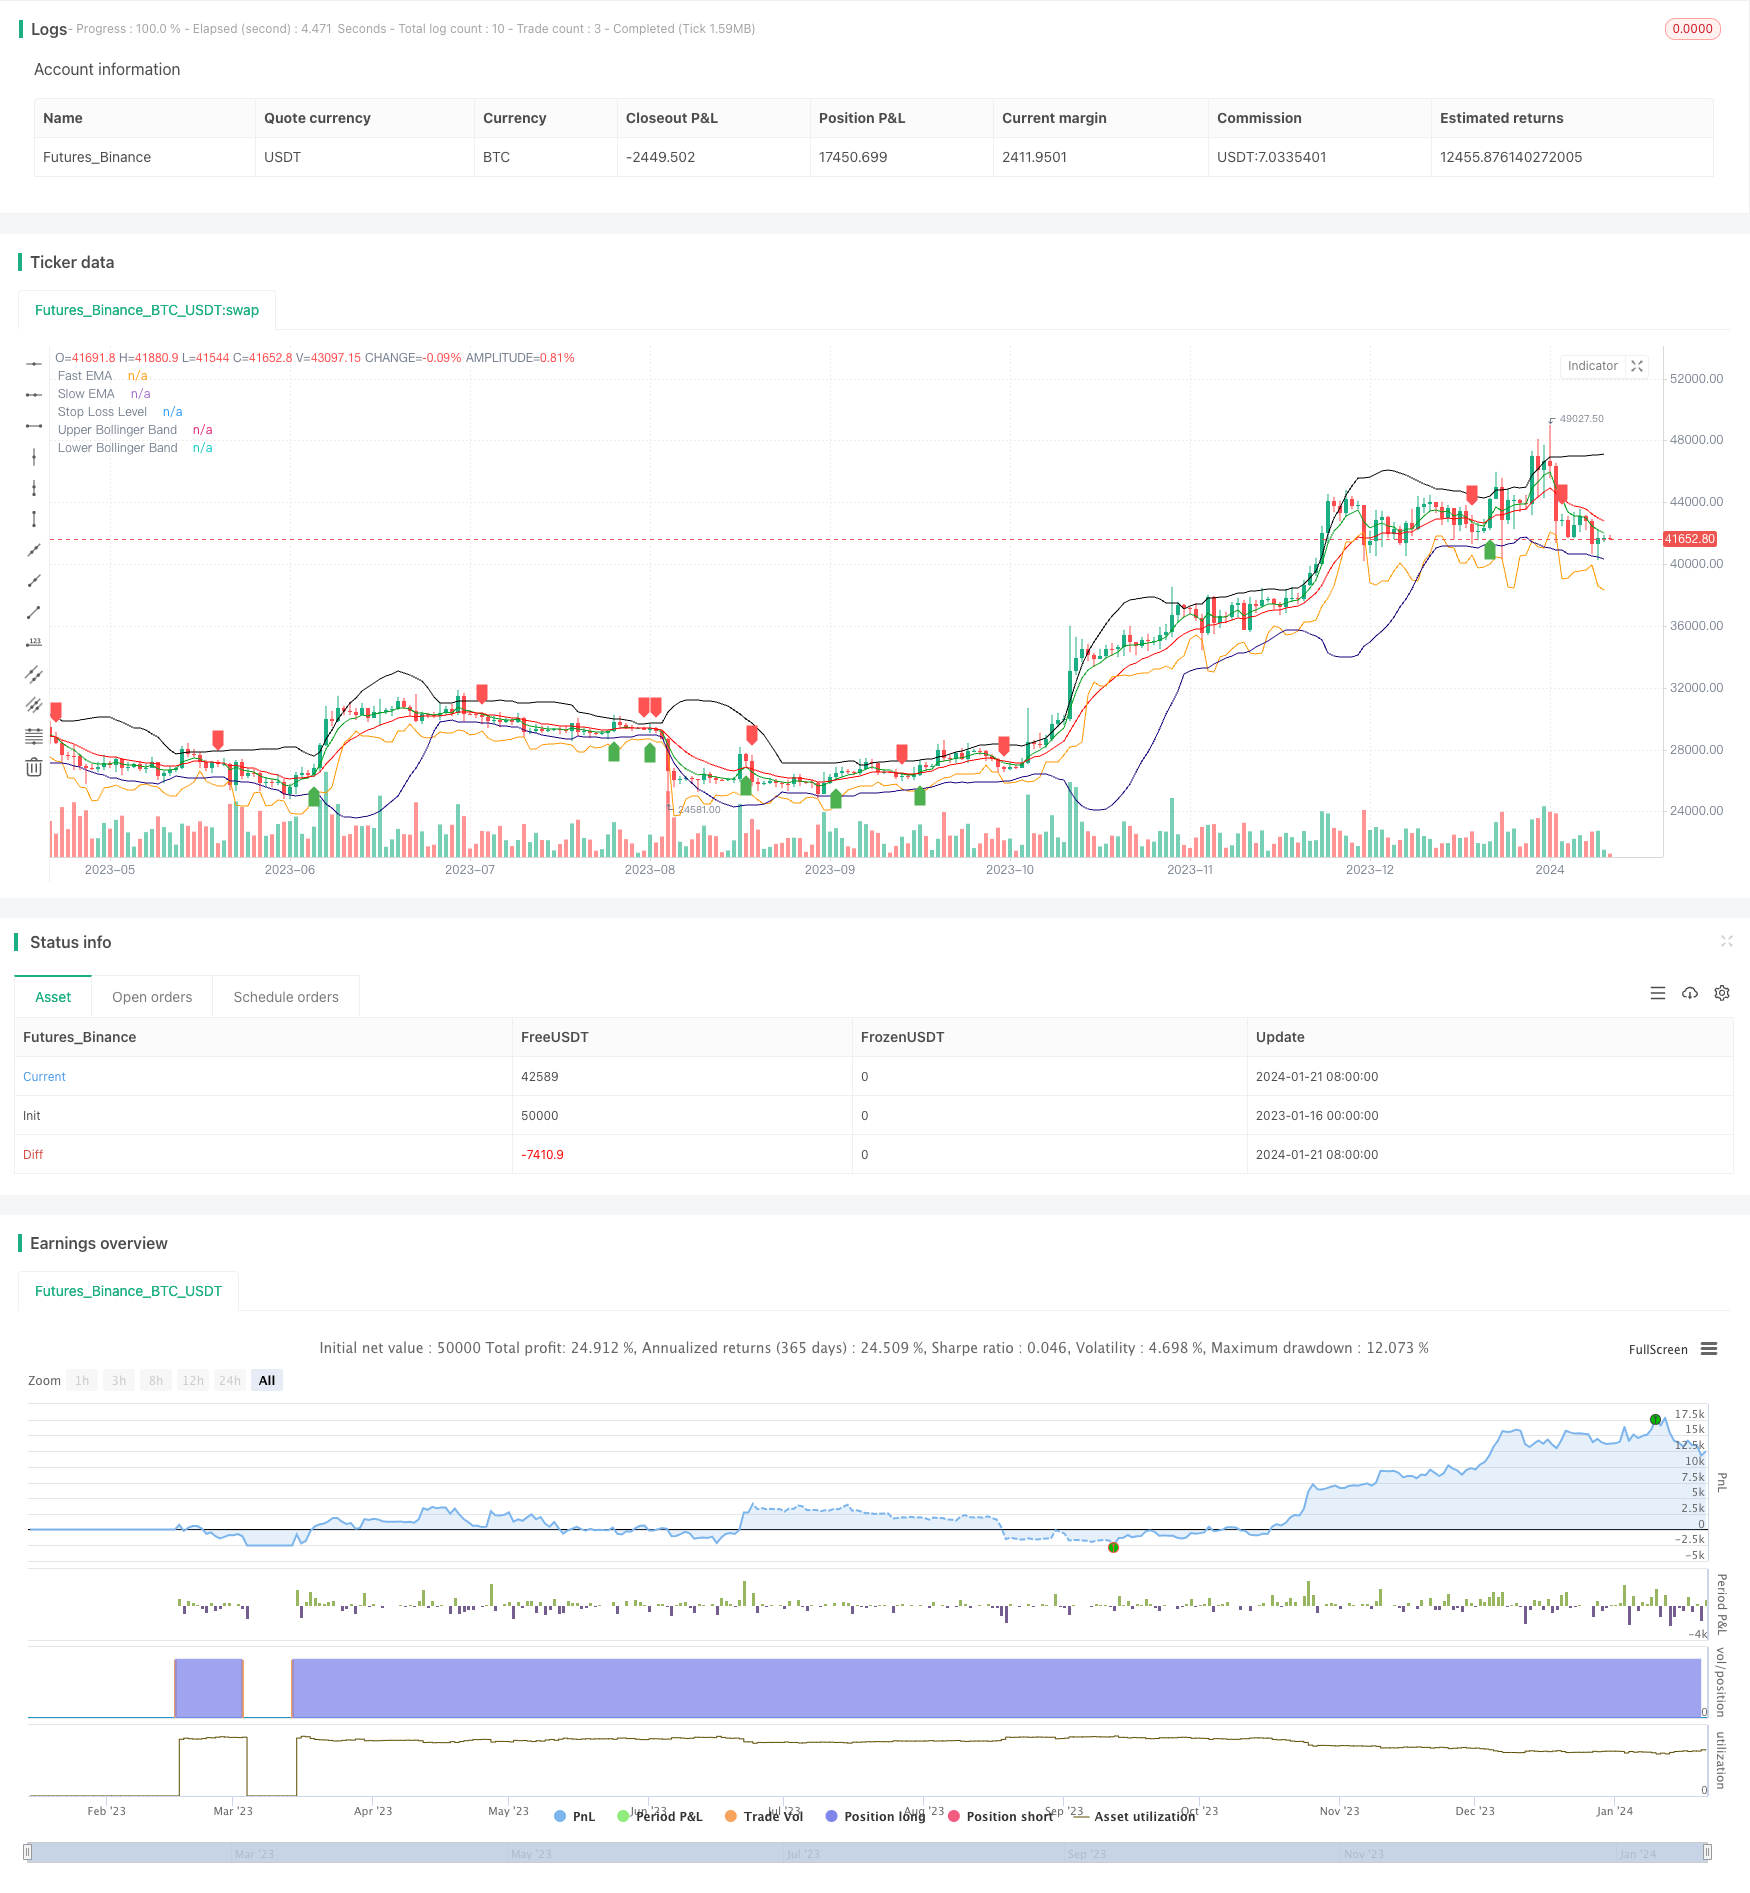
La estrategia Double Gap es una estrategia cuantitativa utilizada para el comercio a corto plazo de Bitcoin y oro. Combina promedios móviles, bandas de Bollinger y paradas ATR para identificar señales de ruptura y gestionar el riesgo.
Estrategia lógica
La estrategia de doble brecha utiliza EMA rápida y cruces de EMA lenta para determinar la dirección de la tendencia. Una señal de compra se genera cuando la EMA rápida cruza por encima de la EMA lenta, y una señal de venta se genera cuando la EMA rápida cruza por debajo de la EMA lenta. Para evitar fallas, la estrategia requiere que el cruce ocurra cerca de las bandas de Bollinger superiores o medias.
Específicamente, para determinar una señal de compra, ambas de las siguientes condiciones deben cumplirse: 1) La EMA rápida cruza por encima de la EMA lenta; 2) El precio de cierre está cerca o por debajo de las bandas superiores o medias de Bollinger.
Además, la estrategia Double Gap utiliza el indicador ATR para calcular un stop loss dinámico para controlar el riesgo de cada operación.
Ventajas
- Identifica las rupturas de alta probabilidad utilizando filtros duales
- El cruce rápido de la EMA juzga la tendencia principal, las bandas de Bollinger filtran las rupturas falsas
- La detención dinámica del ATR controla eficazmente los riesgos comerciales únicos
- Adecuado para la negociación a corto plazo de productos de alta volatilidad como el BTC
Los riesgos
- Los parámetros EMA rápidos y lentos incorrectos pueden producir señales falsas excesivas
- Los parámetros inadecuados de las bandas de Bollinger también reducirán en gran medida la eficacia del filtrado.
- Si el stop loss está demasiado ajustado, aumenta la probabilidad de que se active.
- Se requiere una alta frecuencia de negociación, no adecuada para cuentas pequeñas
Optimización
La estrategia de doble brecha puede optimizarse en los siguientes aspectos:
- Optimizar los parámetros de la media móvil para encontrar las mejores combinaciones de EMA rápida y lenta
- Optimizar los parámetros de las bandas de Bollinger para reducir las tasas de false breakout
- Ajustar el multiplicador de detención ATR de acuerdo con los diferentes productos y regímenes de mercado
- Añadir señal de reentrada después de la parada
- Combinar con otros indicadores como RSI, KD, etc. como confirmación
Conclusión
La estrategia Double Gap identifica de manera efectiva las oportunidades a corto plazo utilizando tanto el seguimiento de tendencias como el filtrado de rupturas. Con la gestión dinámica de stop loss, es adecuada para el comercio a corto plazo de monedas digitales y metales preciosos de alta volatilidad.
/*backtest
start: 2023-01-16 00:00:00
end: 2024-01-22 00:00:00
period: 1d
basePeriod: 1h
exchanges: [{"eid":"Futures_Binance","currency":"BTC_USDT"}]
*/

// This source code is subject to the terms of the Mozilla Public License 2.0 at https://mozilla.org/MPL/2.0/
// © singhak8757

//@version=5
strategy("Bitcoin and Gold 5min Scalping Strategy2.0", overlay=true)


// Input parameters
fastLength = input(5, title="Fast EMA Length")
slowLength = input(13, title="Slow EMA Length")
bollingerLength = input(20, title="Bollinger Band Length")
bollingerMultiplier = input(2, title="Bollinger Band Multiplier")
stopLossMultiplier = input(1, title="Stop Loss Multiplier")

// Calculate EMAs
fastEMA = ta.ema(close, fastLength)
slowEMA = ta.ema(close, slowLength)

// Calculate Bollinger Bands
basis = ta.sma(close, bollingerLength)
upperBand = basis + bollingerMultiplier * ta.stdev(close, bollingerLength)
lowerBand = basis - bollingerMultiplier * ta.stdev(close, bollingerLength)

// Buy condition
buyCondition = ta.crossover(fastEMA, slowEMA) and (close <= upperBand or close <= basis)

// Sell condition
sellCondition = ta.crossunder(fastEMA, slowEMA) and (close >= lowerBand or close >= basis)

// Calculate stop loss level
stopLossLevel = ta.lowest(low, 2)[1] - stopLossMultiplier * ta.atr(14)

// Plot EMAs
plot(fastEMA, color=color.rgb(0, 156, 21), title="Fast EMA")
plot(slowEMA, color=color.rgb(255, 0, 0), title="Slow EMA")

// Plot Bollinger Bands
plot(upperBand, color=color.new(#000000, 0), title="Upper Bollinger Band")
plot(lowerBand, color=color.new(#1b007e, 0), title="Lower Bollinger Band")

// Plot Buy and Sell signals
plotshape(series=buyCondition, title="Buy Signal", color=color.green, style=shape.labelup, location=location.belowbar)
plotshape(series=sellCondition, title="Sell Signal", color=color.red, style=shape.labeldown, location=location.abovebar)

// Plot Stop Loss level
plot(stopLossLevel, color=color.orange, title="Stop Loss Level")

// Strategy logic
strategy.entry("Buy", strategy.long, when = buyCondition)
strategy.exit("Stop Loss/Close", from_entry="Buy", loss=stopLossLevel)
strategy.close("Sell", when = sellCondition)
- RSI CCI Williams%R Estrategia de negociación cuantitativa
- Estrategia de negociación dinámica ajustada al riesgo y al impulso
- Estrategia de negociación cruzada de promedio móvil de impulso
- Estrategia de creador de mercado de banda de Bollinger
- Estrategia de Renko para la media móvil cruzada a largo plazo
- La nueva transacción de Binance está siendo vigilada en línea
- Estrategia de negociación de Renko para el seguimiento de tendencias en dos direcciones
- Estrategia combinada de línea de respuesta de impulso de media móvil e infinita
- Estrategia de seguimiento de supertendencias
- Estrategia de negociación de inversión de tendencia de múltiples indicadores
- Estrategia de cruce entre el MACD y el RSI
- Estrategia de retroceso del impulso
- Estrategia de cruce de la media móvil
- Estrategia de la red de ganancias con oscilación
- Estrategia de avance de oscilación basada en la media móvil
- Estrategia de negociación a corto plazo de reconocimiento de patrones ZigZag
- Estrategia de seguimiento de la volatilidad y la tendencia a través de marcos de tiempo basados en Williams VIX y DEMA
- Estrategia de ruptura de impulso basada en el juicio del ciclo con medias móviles
- Índice de flujo de dinero Estrategia de 5 minutos a través del tiempo y el espacio
- Estrategia de negociación de tendencia cruzada con doble EMA