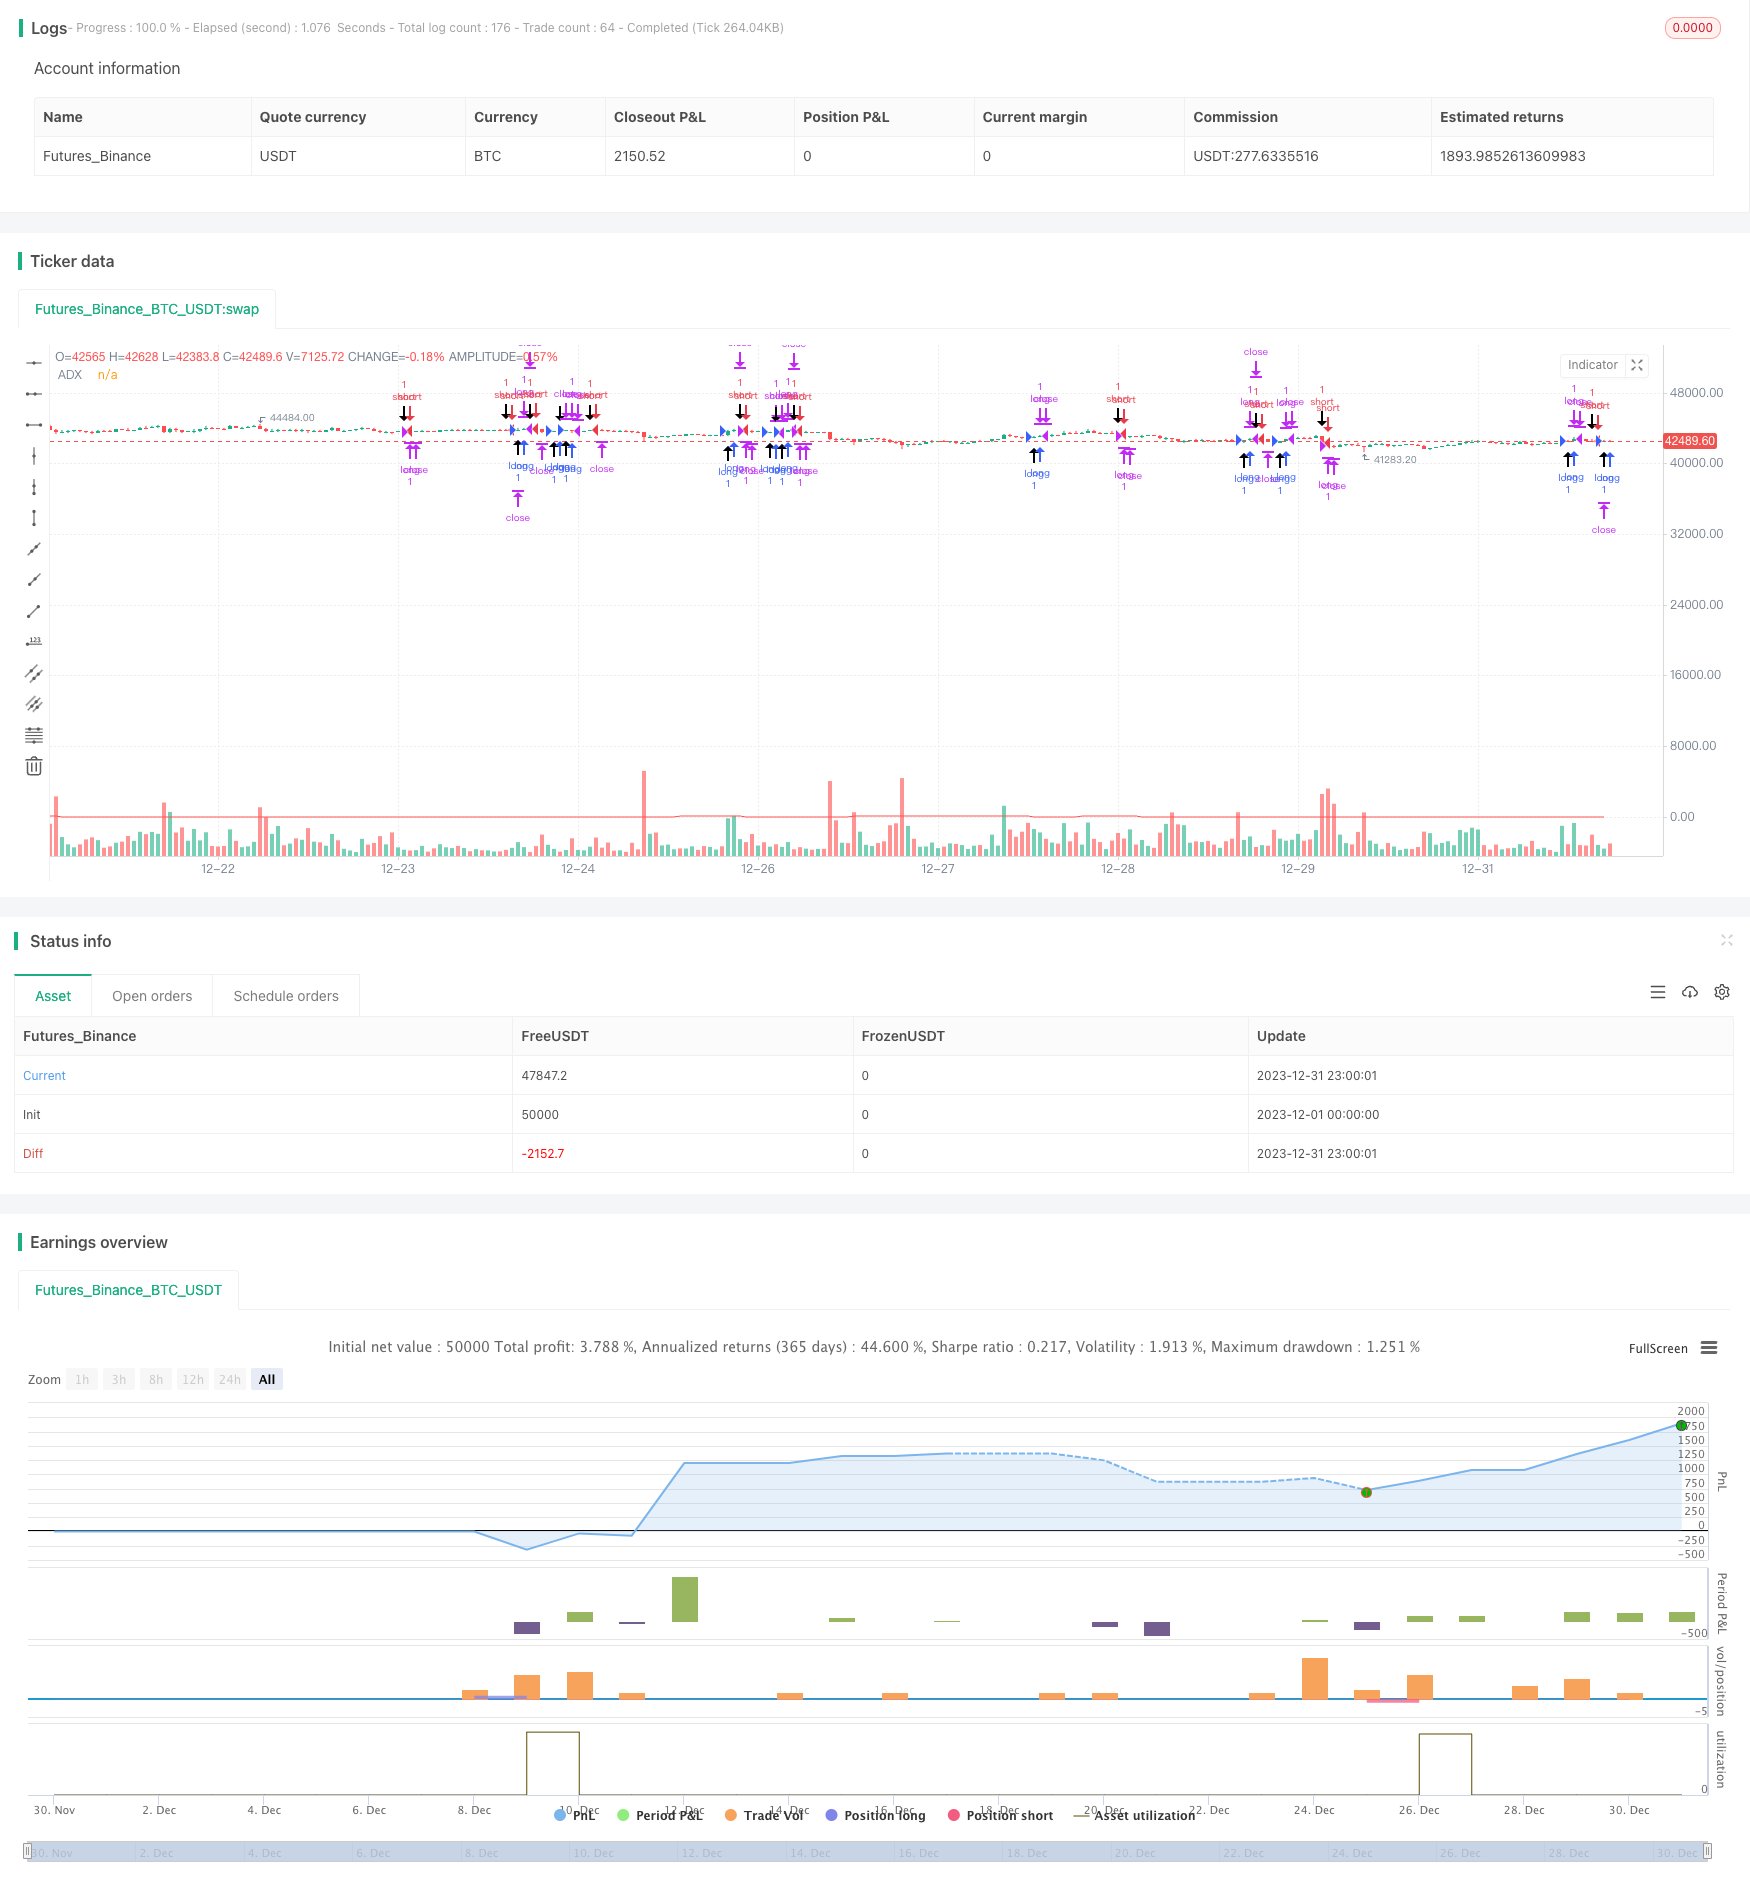
Estrategia de seguimiento de tendencias del petróleo crudo basada en el indicador ADX

Descripción general
Esta estrategia se basa en la estrategia de comercio de futuros de petróleo gratuito de Kevin Davey. La estrategia utiliza el indicador ADX para determinar la tendencia del mercado de petróleo, combinado con el principio de ruptura de precios, para lograr una estrategia de comercio automático de petróleo simple y práctica.
Principio de estrategia
- Cálculo del índice ADX en 14 ciclos
- Cuando el ADX es superior a 10, se considera que hay una tendencia
- Si el precio de cierre es más alto que el precio de cierre antes de la línea 65 K, indica que el precio ha roto y es una señal de posición larga
- Si el precio de cierre está por debajo del precio de cierre antes de la línea K de 65, esto indica que el precio ha roto y es una señal de posición corta.
- Establecimiento de stop loss y stop stop después de la entrada
La estrategia se basa principalmente en el indicador ADX para determinar la tendencia y, en caso de tendencia, generar señales de negociación en función de las rupturas de precios en períodos fijos. Toda la lógica de la estrategia es muy simple y clara.
Análisis de las ventajas estratégicas
- Utiliza el ADX para evaluar las tendencias y evitar perder oportunidades de tendencia
- La ruptura del precio de ciclo fijo genera una señal de mejor retroalimentación
- El código es intuitivo, sencillo de entender y modificar
- Kevin Davey hace pruebas de laboratorio de varios años, no encaja en la curva
Análisis de riesgos estratégicos
- ADX como indicador principal, sensible a la selección de parámetros y la selección de ciclos de ruptura
- La ruptura del ciclo fijo puede haber perdido algunas oportunidades
- El control de pérdidas incorrecto puede aumentar las pérdidas
- Posibles diferencias entre el efecto en disco y la detección
Dirección de optimización de la estrategia
- Optimización de los parámetros ADX y el ciclo de ruptura
- Aumento del ajuste dinámico de las posiciones
- Las estrategias de mejora continuas basadas en los resultados de las pruebas de retroalimentación y la verificación en el terreno
- Introducción de técnicas de aprendizaje automático y de aprendizaje profundo para la optimización de estrategias
Resumir
En general, esta estrategia es una estrategia de comercio de petróleo muy práctica. Utiliza el indicador ADX para determinar la tendencia de manera muy razonable, el principio de ruptura de precios es simple y eficaz, y el efecto de retroalimentación es bueno. Al mismo tiempo, como una estrategia abierta y gratuita de Kevin Davey, tiene una gran fiabilidad práctica.
/*backtest
start: 2023-12-01 00:00:00
end: 2023-12-31 23:59:59
period: 1h
basePeriod: 15m
exchanges: [{"eid":"Futures_Binance","currency":"BTC_USDT"}]
*/

// Strategy idea coded from EasyLanguage to Pinescript
//@version=5
strategy("Kevin Davey Crude free crude oil strategy", shorttitle="CO Fut", format=format.price, precision=2, overlay = true, calc_on_every_tick = true)
adxlen = input(14, title="ADX Smoothing")
dilen = input(14, title="DI Length")
dirmov(len) =>
	up = ta.change(high)
	down = -ta.change(low)
	plusDM = na(up) ? na : (up > down and up > 0 ? up : 0)
	minusDM = na(down) ? na : (down > up and down > 0 ? down : 0)
	truerange = ta.rma(ta.tr, len)
	plus = fixnan(100 * ta.rma(plusDM, len) / truerange)
	minus = fixnan(100 * ta.rma(minusDM, len) / truerange)
	[plus, minus]
adx(dilen, adxlen) =>
	[plus, minus] = dirmov(dilen)
	sum = plus + minus
	adx = 100 * ta.rma(math.abs(plus - minus) / (sum == 0 ? 1 : sum), adxlen)
sig = adx(dilen, adxlen)
plot(sig, color=color.red, title="ADX")

buy = sig > 10 and (close - close[65]) > 0 and (close - close[65])[1] < 0
sell = sig > 10 and (close - close[65]) < 0 and (close - close[65])[1] > 0

plotshape(buy, style = shape.arrowup, location = location.belowbar,size = size.huge)
plotshape(sell, style = shape.arrowdown, location = location.abovebar,size = size.huge)

if buy
	strategy.entry("long", strategy.long)
if sell
	strategy.entry("short", strategy.short)

if strategy.position_size != 0
	strategy.exit("long", profit = 450, loss = 300)
	strategy.exit("short", profit = 450, loss = 300)


// GetTickValue() returns the currency value of the instrument's
// smallest possible price movement.
GetTickValue() =>
    syminfo.mintick * syminfo.pointvalue

// On the last historical bar, make a label to display the
// instrument's tick value
if barstate.islastconfirmedhistory
    label.new(x=bar_index + 1, y=close, style=label.style_label_left,
         color=color.black, textcolor=color.white, size=size.large,
         text=syminfo.ticker + " has a tick value of:\n" +
             syminfo.currency + " " + str.tostring(GetTickValue()))