Stratégie ATR pour les futures de crypto-monnaie multifonctions (enseignement)
Auteur:L'inventeur de la quantification - un petit rêve, Créé à: 2022-01-07 11:11:54, Mis à jour à: 2023-09-15 20:54:33
Stratégie ATR pour les futures de crypto-monnaie multifonctions (enseignement)
Récemment, les utilisateurs de plates-formes ont eu beaucoup d'espoir d'être en mesure de transférer une stratégie de Mac vers une stratégie JavaScript, ce qui permet d'ajouter de nombreuses idées d'optimisation avec flexibilité; et même d'étendre la stratégie à une variété de versions. Parce que les stratégies Mac sont généralement des stratégies de tendance, et beaucoup sont exécutées avec un modèle de prix de clôture. Les stratégies demandent des interfaces API d'échange qui ne sont pas très fréquentes, ce qui est plus approprié pour transférer plusieurs versions de la stratégie.
Stratégies pour la transplantation de la langue
TR:=MAX(MAX((H-L),ABS(REF(C,1)-H)),ABS(REF(C,1)-L));
ATR:=EMA(TR,LENGTH2);

MIDLINE^^EMA((H + L + C)/3,LENGTH1);
UPBAND^^MIDLINE + N*ATR;
DOWNBAND^^MIDLINE - N*ATR;


BKVOL=0 AND C>=UPBAND AND REF(C,1)<REF(UPBAND,1),BPK;
SKVOL=0 AND C<=DOWNBAND AND REF(C,1)>REF(DOWNBAND,1),SPK;

BKVOL>0 AND C<=MIDLINE,SP(BKVOL);
SKVOL>0 AND C>=MIDLINE,BP(SKVOL);
// 止损
// stop loss
C>=SKPRICE*(1+SLOSS*0.01),BP;
C<=BKPRICE*(1-SLOSS*0.01),SP;
AUTOFILTER;
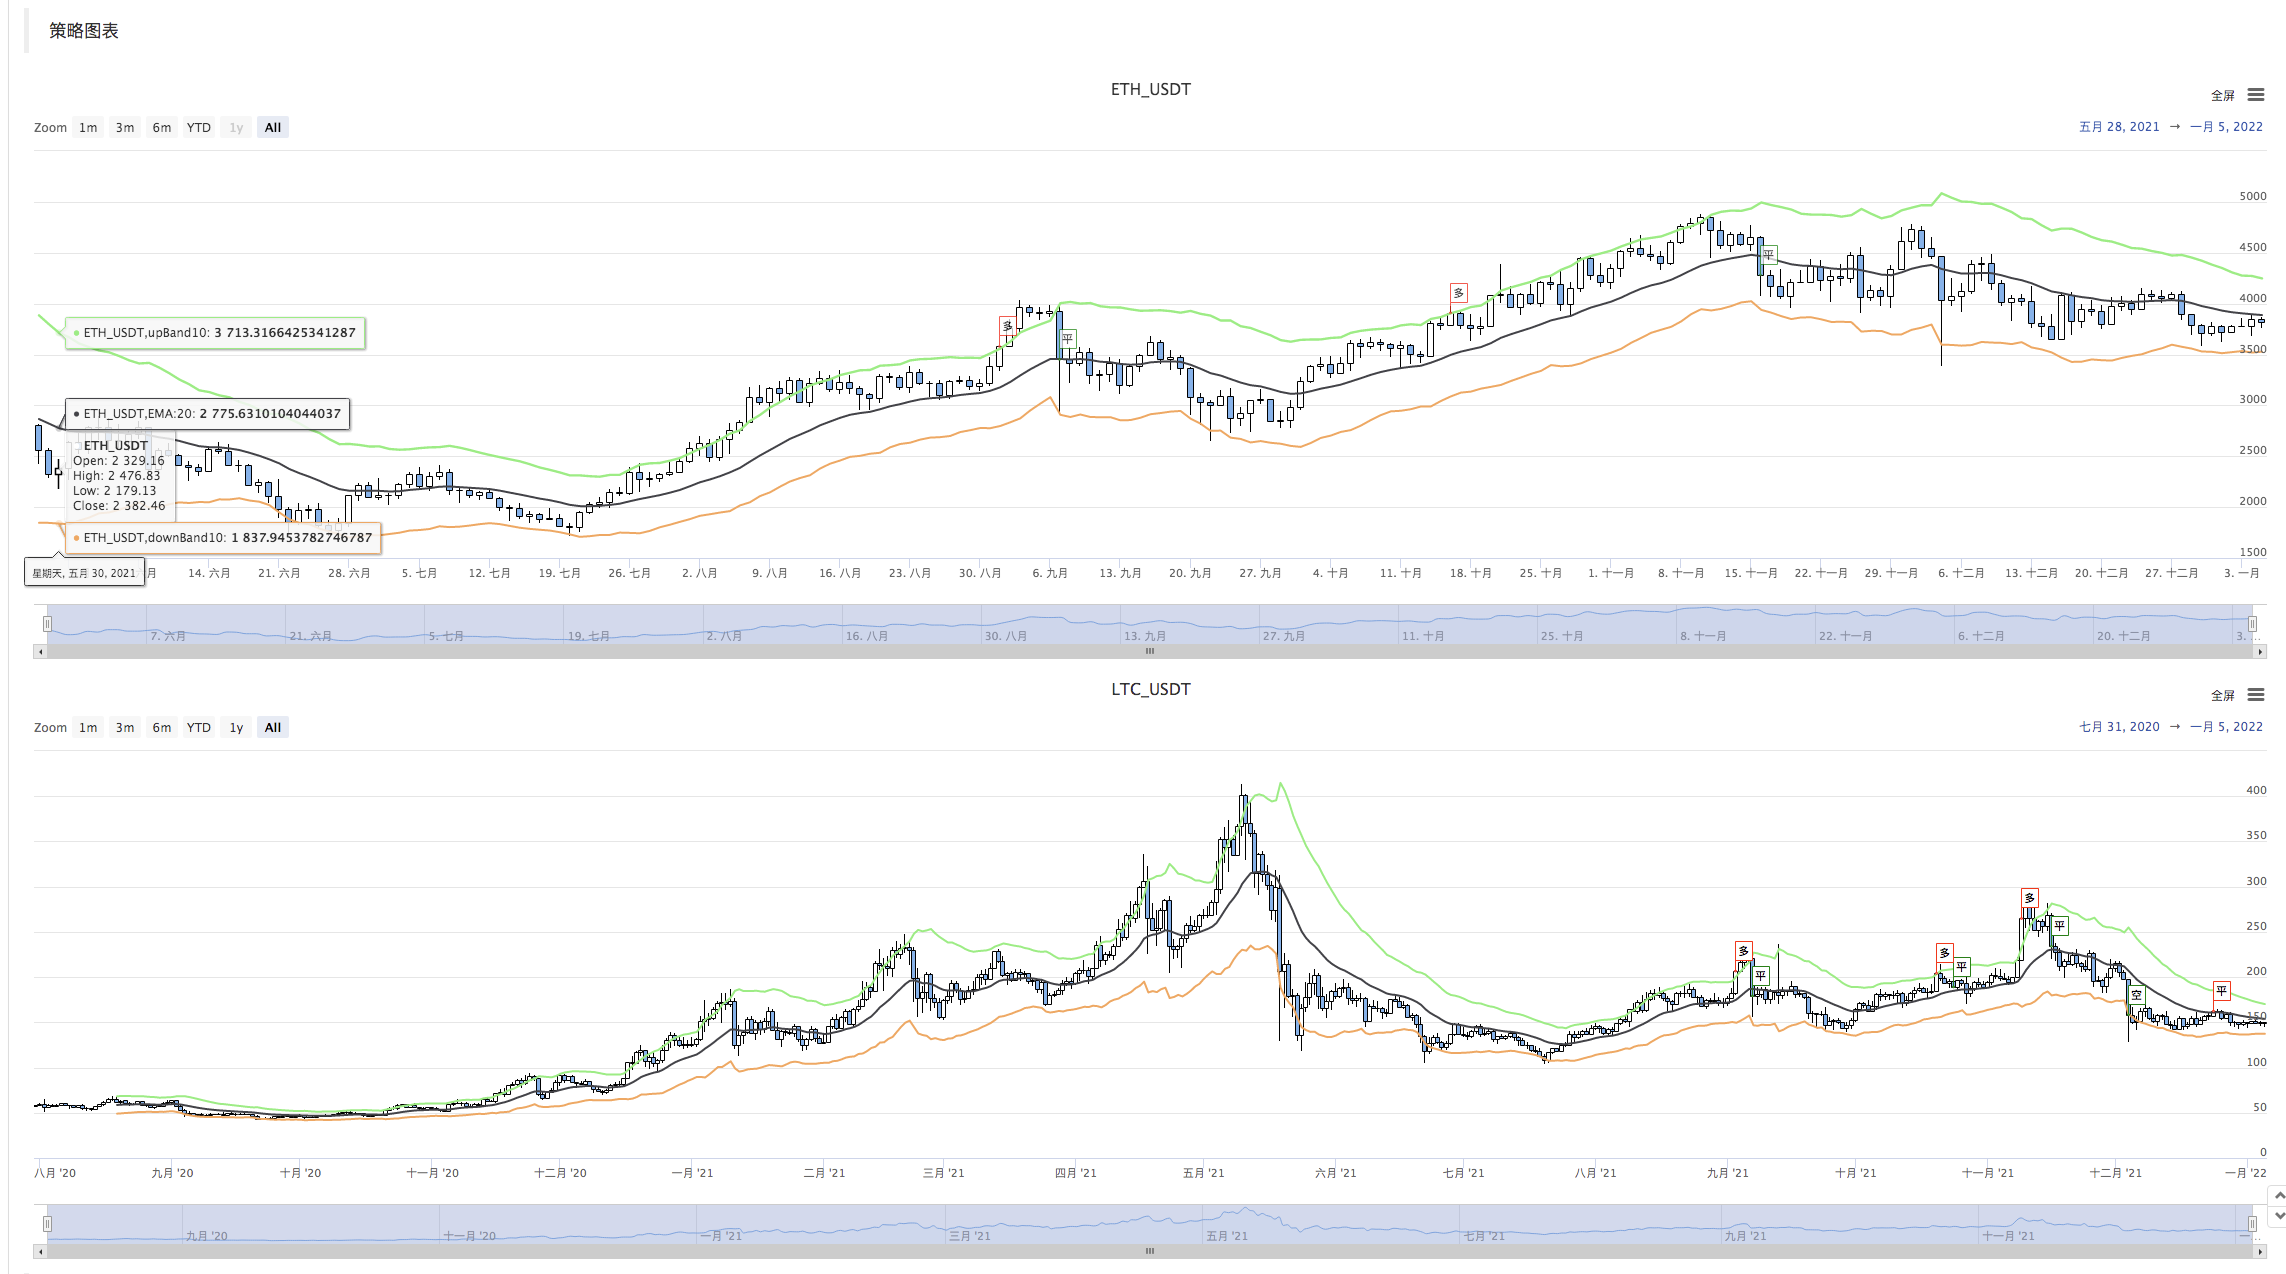
La stratégie de trading est simple: on calcule d'abord l'ATR en fonction des paramètres, puis on calcule les moyennes des prix de clôture, des moyennes des prix de clôture et des moyennes des prix de clôture de tous les BAR de la ligne K, et on obtient un indicateur EMA en fonction de ces moyennes. Enfin, on combine le coefficient N dans le paramètre ATR et on calcule la pente (upBand, downBand).
L'ouverture de la position, la contre-manche est basée sur le prix de clôture de la rupture de la trajectoire vers le bas. Lorsque le prix de clôture atteint la ligne médiane, le prix de clôture atteint le prix de stop-loss (selon le stop-loss SLOSS, le SLOSS est de 1 ou 0.01, soit 1%). La stratégie est exécutée selon un modèle de prix de clôture.
OK, nous avons compris les besoins stratégiques et les idées de la langue Ma, alors nous pouvons commencer à la transplanter.
Transplantation, prototypes de stratégies de conception
Le protocole de stratégie ne doit pas dépasser 1 à 200 lignes de code. Pour faciliter l'apprentissage de l'idée de la stratégie, les annotations sont écrites directement dans le code de la stratégie.
// 解析params参数,从字符串解析为对象
var arrParam = JSON.parse(params)

// 该函数创建图表配置
function createChartConfig(symbol, atrPeriod, emaPeriod, index) {   // symbol : 交易对, atrPeriod : ATR参数周期 , emaPeriod : EMA参数周期 , index 对应的交易所对象索引
    var chart = {
        __isStock: true,
        extension: {
                layout: 'single',
                height: 600,
        },
        title : { text : symbol},
        xAxis: { type: 'datetime'},
        series : [
            {
                type: 'candlestick',    // K线数据系列
                name: symbol,
                id: symbol + "-" + index,
                data: []
            }, {
                type: 'line',           // EMA
                name: symbol + ',EMA:' + emaPeriod,
                data: [],
            }, {
                type: 'line',           // upBand
                name: symbol + ',upBand' + atrPeriod,
                data: []
            }, {
                type: 'line',           // downBand
                name: symbol + ',downBand' + atrPeriod,
                data: []
            }, {
                type: 'flags',
                onSeries: symbol + "-" + index,
                data: [],
            }
        ]
    }
    return chart
}

// 主要逻辑
function process(e, kIndex, c) {    // e 即交易所对象,exchanges[0] ... , kIndex K线数据在图表中的数据系列, c 为图表对象
    // 获取K线数据
    var r = e.GetRecords(e.param.period)
    if (!r || r.length < e.param.atrPeriod + 2 || r.length < e.param.emaPeriod + 2) {
        // K线数据长度不足则返回
        return
    }

    // 计算ATR指标
    var atr = TA.ATR(r, e.param.atrPeriod)
    var arrAvgPrice = []
    _.each(r, function(bar) {
        arrAvgPrice.push((bar.High + bar.Low + bar.Close) / 3)
    })
    // 计算EMA指标
    var midLine = TA.EMA(arrAvgPrice, e.param.emaPeriod)
    // 计算上下轨
    var upBand = []
    var downBand = []
    _.each(midLine, function(mid, index) {
        if (index < e.param.emaPeriod - 1 || index < e.param.atrPeriod - 1) {
            upBand.push(NaN)
            downBand.push(NaN)
            return
        }
        upBand.push(mid + e.param.trackRatio * atr[index])
        downBand.push(mid - e.param.trackRatio * atr[index])
    })

    // 画图
    for (var i = 0 ; i < r.length ; i++) {
        if (r[i].Time == e.state.lastBarTime) {
            // 更新
            c.add(kIndex, [r[i].Time, r[i].Open, r[i].High, r[i].Low, r[i].Close], -1)
            c.add(kIndex + 1, [r[i].Time, midLine[i]], -1)
            c.add(kIndex + 2, [r[i].Time, upBand[i]], -1)
            c.add(kIndex + 3, [r[i].Time, downBand[i]], -1)
        } else if (r[i].Time > e.state.lastBarTime) {
            // 添加
            e.state.lastBarTime = r[i].Time
            c.add(kIndex, [r[i].Time, r[i].Open, r[i].High, r[i].Low, r[i].Close])
            c.add(kIndex + 1, [r[i].Time, midLine[i]])
            c.add(kIndex + 2, [r[i].Time, upBand[i]])
            c.add(kIndex + 3, [r[i].Time, downBand[i]])
        }
    }

    // 检测持仓
    var pos = e.GetPosition()
    if (!pos) {
        return
    }
    var holdAmount = 0
    var holdPrice = 0
    if (pos.length > 1) {
        throw "同时检测到多空持仓!"
    } else if (pos.length != 0) {
        holdAmount = pos[0].Type == PD_LONG ? pos[0].Amount : -pos[0].Amount
        holdPrice = pos[0].Price
    }

    if (e.state.preBar == -1) {
        e.state.preBar = r[r.length - 1].Time
    }
    // 检测信号
    if (e.state.preBar != r[r.length - 1].Time) {   // 收盘价模型
        if (holdAmount <= 0 && r[r.length - 3].Close < upBand[upBand.length - 3] && r[r.length - 2].Close > upBand[upBand.length - 2]) {   // 收盘价上穿上轨
            if (holdAmount < 0) {   // 持有空仓,平仓
                Log(e.GetCurrency(), "平空仓", "#FF0000")
                $.CoverShort(e, e.param.symbol, Math.abs(holdAmount))
                c.add(kIndex + 4, {x: r[r.length - 2].Time, color: 'red', shape: 'flag', title: '平', text: "平空仓"})
            }
            // 开多
            Log(e.GetCurrency(), "开多仓", "#FF0000")
            $.OpenLong(e, e.param.symbol, 10)
            c.add(kIndex + 4, {x: r[r.length - 2].Time, color: 'red', shape: 'flag', title: '多', text: "开多仓"})
        } else if (holdAmount >= 0 && r[r.length - 3].Close > downBand[downBand.length - 3] && r[r.length - 2].Close < downBand[downBand.length - 2]) {  // 收盘价下穿下轨
            if (holdAmount > 0) {   // 持有多仓,平仓
                Log(e.GetCurrency(), "平多仓", "#FF0000")
                $.CoverLong(e, e.param.symbol, Math.abs(holdAmount))
                c.add(kIndex + 4, {x: r[r.length - 2].Time, color: 'green', shape: 'flag', title: '平', text: "平多仓"})
            }
            // 开空
            Log(e.GetCurrency(), "开空仓", "#FF0000")
            $.OpenShort(e, e.param.symbol, 10)
            c.add(kIndex + 4, {x: r[r.length - 2].Time, color: 'green', shape: 'flag', title: '空', text: "开空仓"})
        } else {
            // 平仓
            if (holdAmount > 0 && (r[r.length - 2].Close <= holdPrice * (1 - e.param.stopLoss) || r[r.length - 2].Close <= midLine[midLine.length - 2])) {   // 持多仓,收盘价小于等于中线,按开仓价格止损
                Log(e.GetCurrency(), "触发中线或止损,平多仓", "#FF0000")
                $.CoverLong(e, e.param.symbol, Math.abs(holdAmount))
                c.add(kIndex + 4, {x: r[r.length - 2].Time, color: 'green', shape: 'flag', title: '平', text: "平多仓"})
            } else if (holdAmount < 0 && (r[r.length - 2].Close >= holdPrice * (1 + e.param.stopLoss) || r[r.length - 2].Close >= midLine[midLine.length - 2])) {  // 持空仓,收盘价大于等于中线,按开仓价格止损
                Log(e.GetCurrency(), "触发中线或止损,平空仓", "#FF0000")
                $.CoverShort(e, e.param.symbol, Math.abs(holdAmount))
                c.add(kIndex + 4, {x: r[r.length - 2].Time, color: 'red', shape: 'flag', title: '平', text: "平空仓"})
            }
        }
        e.state.preBar = r[r.length - 1].Time
    }
}

function main() {
    var arrChartConfig = []
    if (arrParam.length != exchanges.length) {
        throw "参数和交易所对象不匹配!"
    }
    var arrState = _G("arrState")
    _.each(exchanges, function(e, index) {
        if (e.GetName() != "Futures_Binance") {
            throw "不支持该交易所!"
        }
        e.param = arrParam[index]
        e.state = {lastBarTime: 0, symbol: e.param.symbol, currency: e.GetCurrency()}
        if (arrState) {
            if (arrState[index].symbol == e.param.symbol && arrState[index].currency == e.GetCurrency()) {
                Log("恢复:", e.state)
                e.state = arrState[index]
            } else {
                throw "恢复的数据和当前设置不匹配!"
            }
        }
        e.state.preBar = -1   // 初始设置-1
        e.SetContractType(e.param.symbol)
        Log(e.GetName(), e.GetLabel(), "设置合约:", e.param.symbol)
        arrChartConfig.push(createChartConfig(e.GetCurrency(), e.param.atrPeriod, e.param.emaPeriod, index))
    })
    var chart = Chart(arrChartConfig)
    chart.reset()

    while (true) {
        _.each(exchanges, function(e, index) {
            process(e, index + index * 4, chart)
            Sleep(500)
        })
    }
}

function onexit() {
    // 记录 e.state
    var arrState = []
    _.each(exchanges, function(e) {
        arrState.push(e.state)
    })
    Log("记录:", arrState)
    _G("arrState", arrState)
}
Paramètres de stratégie:
var params = '[{
        "symbol" : "swap",    // 合约代码
        "period" : 86400,     // K线周期,86400秒即为一天
        "stopLoss" : 0.07,    // 止损系数,0.07即7%
        "atrPeriod" : 10,     // ATR指标参数
        "emaPeriod" : 10,     // EMA指标参数
        "trackRatio" : 1,     // 上下轨系数
        "openRatio" : 0.1     // 预留的开仓百分比,暂时没支持
    }, {
        "symbol" : "swap",
        "period" : 86400,
        "stopLoss" : 0.07,
        "atrPeriod" : 10,
        "emaPeriod" : 10,
        "trackRatio" : 1,
        "openRatio" : 0.1
    }]'
Le test de répétition


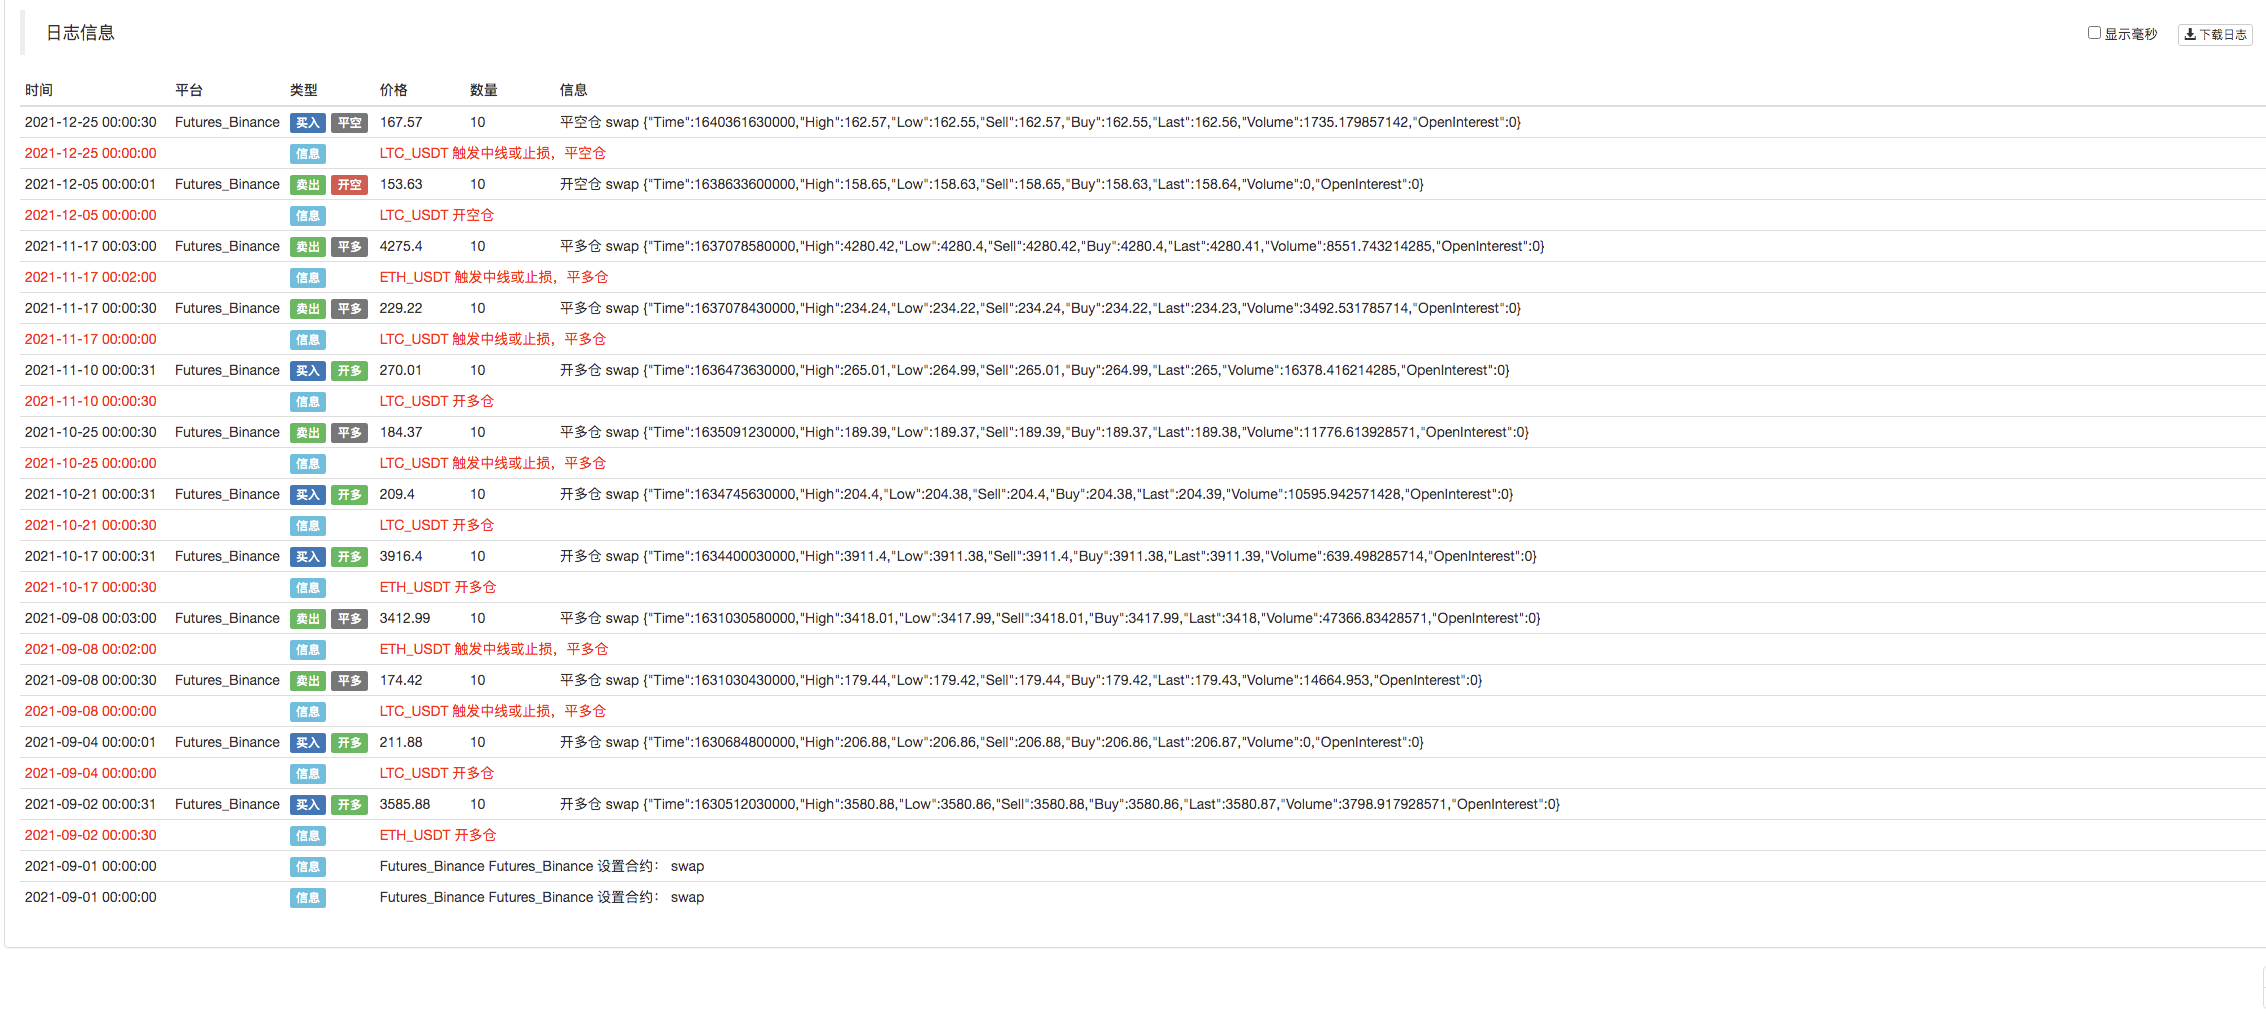
Le code source de la stratégie:https://www.fmz.com/strategy/339344
Cette stratégie est uniquement destinée à la réévaluation, à l'apprentissage et à la recherche.
- Introduction à l'arbitrage au retard de plomb dans les crypto-monnaies (2)
- Introduction à la suite de Lead-Lag dans les monnaies numériques (2)
- Discussion sur la réception de signaux externes de la plateforme FMZ: une solution complète pour la réception de signaux avec un service Http intégré dans la stratégie
- Exploration de la réception de signaux externes sur la plateforme FMZ: stratégie intégrée pour la réception de signaux sur le service HTTP
- Introduction à l'arbitrage au retard de plomb dans les crypto-monnaies (1)
- Introduction à la suite de Lead-Lag dans les monnaies numériques (1)
- Discussion sur la réception de signaux externes de la plateforme FMZ: API étendue VS stratégie intégrée au service HTTP
- Débat sur la réception de signaux externes sur la plateforme FMZ: API étendue contre stratégie de service HTTP intégré
- Discussion sur la méthode de test de stratégie basée sur le générateur de tickers aléatoires
- Une méthode de test stratégique basée sur un générateur de marché aléatoire
- Nouvelle fonctionnalité de FMZ Quant: Utilisez la fonction _Serve pour créer facilement des services HTTP
- Si je n'avais pas encore écrit de stratégie en utilisant le langage Pine, si facile à apprendre, alors je...
- Explication détaillée des stratégies d'équilibre et de réseau
- C'est un peu une beauté - comment concevoir une stratégie simple et efficace.
- Une nouvelle stratégie de vol de crypto-monnaie (enseignement)
- Concevoir une bibliothèque de tracés à plusieurs graphiques
- Concevoir une bibliothèque de lignes de dessins multicartographiques
- 60 lignes de code pour réaliser une idée -- la stratégie de transcription contractuelle.
- Conception d'un système de gestion synchrone des commandes basé sur la quantification FMZ (2)
- Conception d'un système de gestion synchrone des commandes basé sur la quantification FMZ (1)
- La stratégie de Martin pour les futures de monnaie numérique
- Retour sur le marché de la crypto-monnaie en 2021 avec les 10 stratégies les plus simples à manquer
- L'implémentation du langage JavaScript pour les indicateurs Fisher et le dessin sur FMZ
- Stratégies binaires pour la monnaie numérique à la mode (enseignement)
- Stratégie des virages binaires sur les contrats à terme sur les crypto-monnaies
- Actualités sur la stratégie des taux de change et recommandations d'opération
- Des études et des exemples de conception de stratégies de couverture à terme
- La plateforme FMZ est une application Python reptile pour la première fois - pour récupérer le contenu des annonces de Binance.
- Le modèle de conception de la stratégie dYdX - stratégie de trading aléatoire
- L'inventeur de la plateforme de négociation quantitative APP utilise un accès rapide
- Analyse de la différence entre les échéances des contrats sur la devise et les taux de rebond