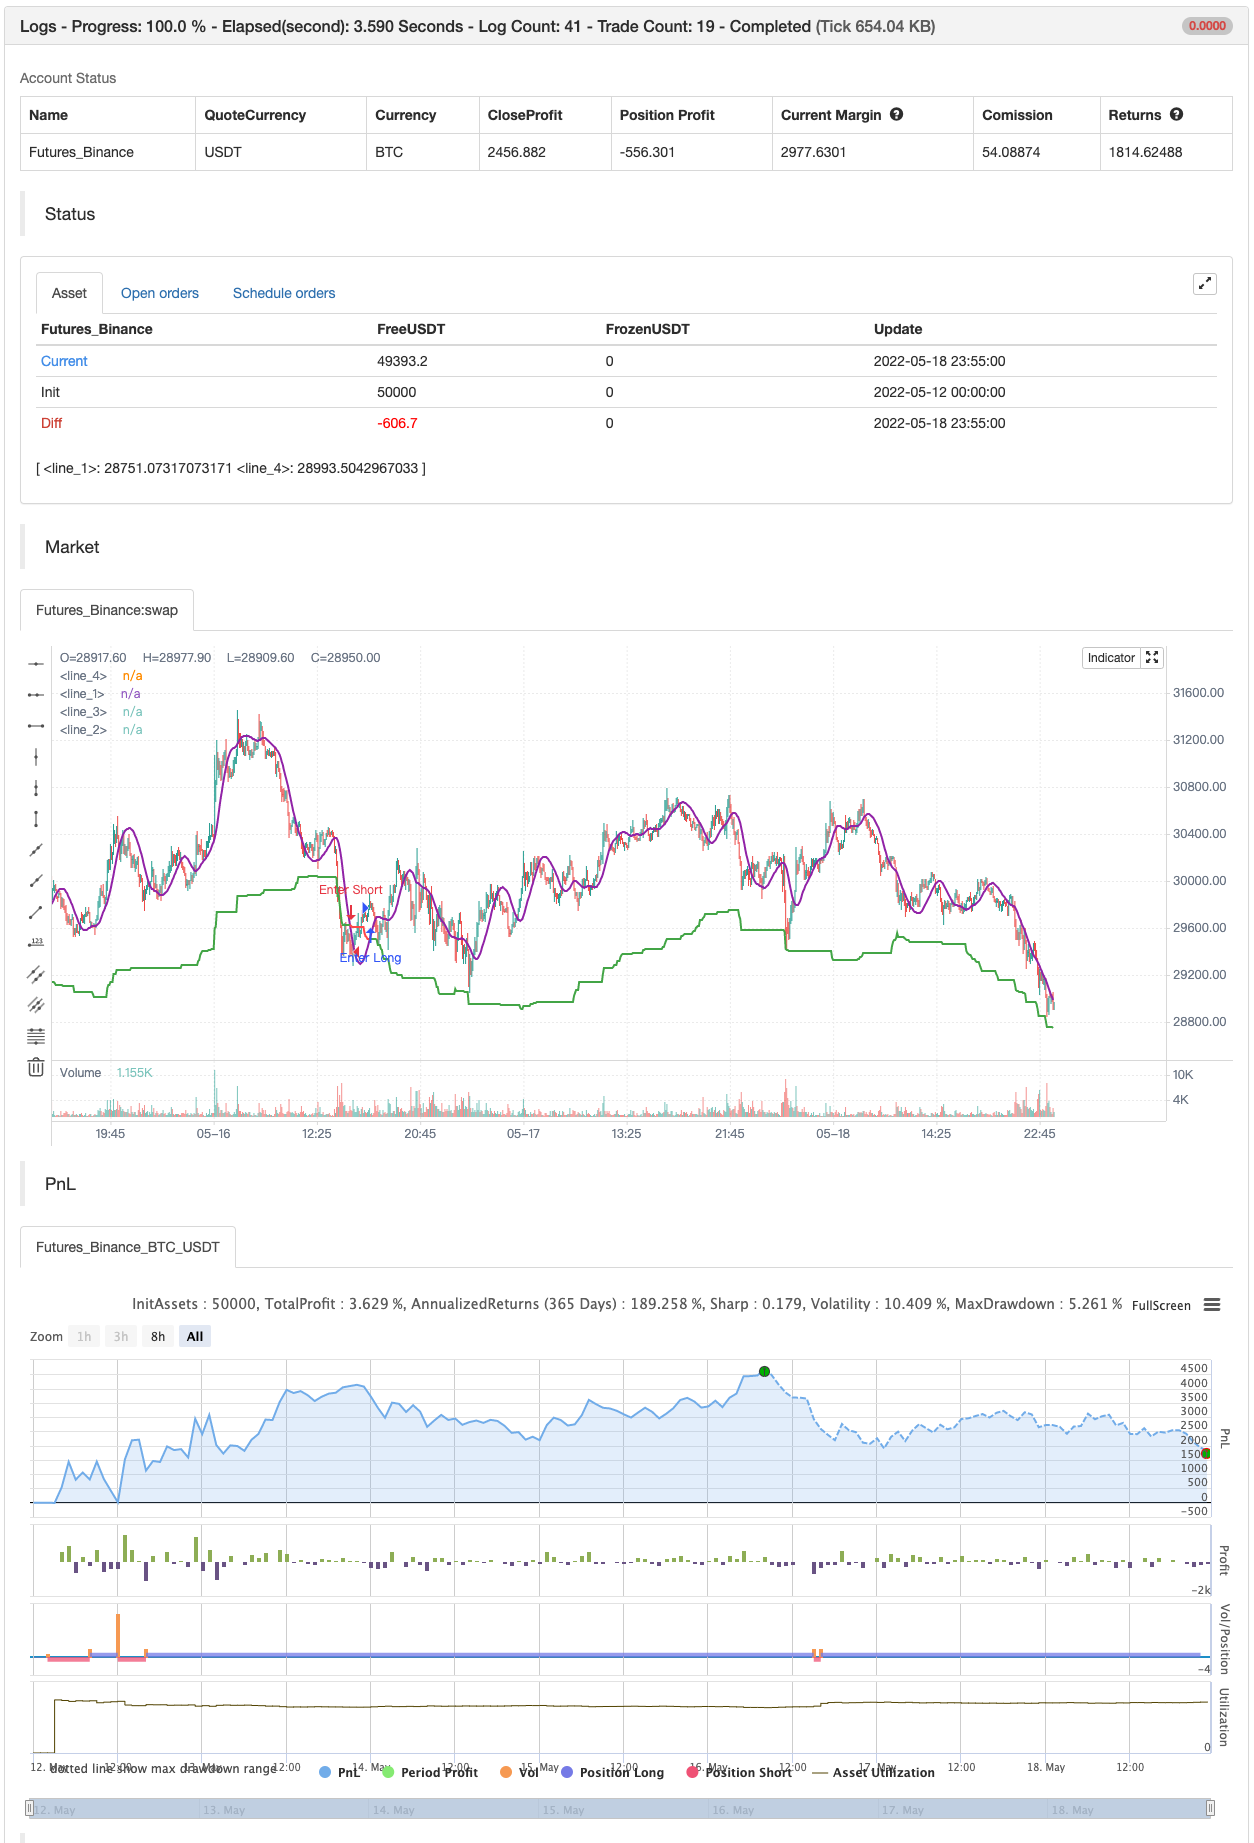
Ligne de détection
Auteur:ChaoZhang est là., Date: 2022-05-20 16h58 et 28 minLes étiquettes:HMA
Cet indicateur détermine les périodes de marché haussier où un investisseur peut détenir l'actif et les périodes de marché baissier où il devrait éviter de le détenir. Techniquement, l'indicateur est un filtre de tendance asymétrique visant à tenir compte du fait que les sold-offs du marché ont tendance à être plus marqués que les tendances haussières.
Comment l' utiliser L'indicateur de tendance est un filtrage de tendance, qui est un filtrage de tendance à la hausse et à la baisse. Lorsque le prix ou la ligne lissée traverse le filtre de tendance ci-dessus, il s'agit d'un signal de tendance haussière. L'indicateur marque de tels croisements avec des cercles verts. Il colore également le fond du graphique en vert dans une tendance haussière. Le prix ou la ligne violette qui traverse le filtre de tendance ci-dessous signifie un signal de tendance baissière. Les signaux de tendance baissière s'affichent sous forme de cercles rouges.
Réglages
Sensitivité
test de retour

/*backtest
start: 2022-05-12 00:00:00
end: 2022-05-18 23:59:00
period: 5m
basePeriod: 1m
exchanges: [{"eid":"Futures_Binance","currency":"BTC_USDT"}]
*/

// This source code is subject to the terms of the Mozilla Public License 2.0 at https://mozilla.org/MPL/2.0/
// © AstrideUnicorn

// Asymmetrical Trend Filter aka HODL Line

//@version=5
indicator("HODL LINE", overlay=true)

// initialize indicator period parameter and the asymmetry paramter
length = 300
asymmetry =  0.05 //input.float(defval=0.05,step=0.01, minval=0.01, maxval=0.3)

// script inputs
sensitivity = input.string(defval="Hold Short Term", title="Sensitivity", options=['Super Sensitive','Hold Short Term', 'Hold Medium Term', 'Hold Long Term'])
use_smoothing = input.bool(defval=true, title="Use Smoothing")


// Set the indicator period based on the choosen sensitivity
if sensitivity == 'Super Sensitive'
    length:=50

if sensitivity == 'Hold Short Term'
    length:=100

if sensitivity == 'Hold Medium Term'
    length:=300

if sensitivity == 'Hold Long Term'
    length:=500

// Calculate HODL Line - an assymetric trend filter
HODL_line = (ta.highest(close,length) + ta.lowest(close,length))/(2.0 + asymmetry)

// Calculate smoothed price time series
smoothed_price = ta.hma(close,50)

// Use closing price or smoothed price based on the choosen option for smoothing
price_model = use_smoothing ? smoothed_price : close

// Define conditional color for the HODL Line
hodl_line_color = price_model >= HODL_line ? color.green : color.red

// define the HODL Line crossing conditions
crossing_condition_bull = ta.crossover(price_model, HODL_line)
crossing_condition_bear = ta.crossunder(price_model, HODL_line)

// plotting
plot(HODL_line, color = hodl_line_color, linewidth = 2)

plot(crossing_condition_bull?HODL_line:na, color = color.new(color.green,40), style= plot.style_circles, linewidth = 20)
plot(crossing_condition_bear?HODL_line:na, color = color.new(color.red,40), style= plot.style_circles, linewidth = 20)

bgcolor(color.new(hodl_line_color,80))

plot(use_smoothing?price_model:na, color=color.purple, linewidth=2)

if crossing_condition_bull
    strategy.entry("Enter Long", strategy.long)
else if crossing_condition_bear
    strategy.entry("Enter Short", strategy.short)
- Stratégie de quantification croisée des moyennes mobiles dynamiques convergentes sur plusieurs indicateurs
- La stratégie de rupture de la dynamique de Bollinger à plusieurs moments combinée à la stratégie de la ligne droite de Hull
- Stratégie de quantification des moyennes mobiles à double équation croisée combinée à Hull
- Stratégie de détermination de tendance EMA réfléchissante basée sur la moyenne mobile de Hull
- Stratégie de croisement linéaire multicyclique flexible version avancée
- Stratégie de négociation de la ligne moyenne croisée pour s'adapter aux prix
- Stratégie de suivi de la tendance à la rupture dynamique en combinaison de plusieurs indicateurs
- HMA optimise la stratégie de négociation quantitative multi-cyclique combinée à un stop-loss dynamique
- Stratégie de capture des tendances des moyennes et des dynamiques du marché
- Stratégie de croisement des moyennes mobiles de Hull multicyclique
- Stratégie de combinaison RSI et MA
- L'entropie de Shannon V2
- Supertrend à l'arrière avec arrêt de traînée
- Flux de volume v3
- scalping horaire avec ma & rsi - ogcheckers
- ATR lissé
- Trouveur de blocs de commande
- Les résultats de l'analyse sont publiés dans le rapport annuel annuel annuel.
- Signaux QQE
- Filtre de l'amplitude de grille en U
- Indicateur MACD personnalisé CM - Cadre temporel multiple - V2
- 2 Détection de la direction des couleurs moyennes mobiles
- L'outil R1 pour le scalping PullBack
- La stratégie d'achat et de vente dépend de AO+Stoch+RSI+ATR
- Le montant de l'aide est calculé en fonction de l'évolution de la situation.
- Ratio énergie directionnelle accélérée par volume RedK
- Pas de peinture.
- Les barres de dynamique REDK
- Superjump retourner en arrière Bollinger Band
- La tendance de Fukuiz
- Le BOT de Johnny